
|
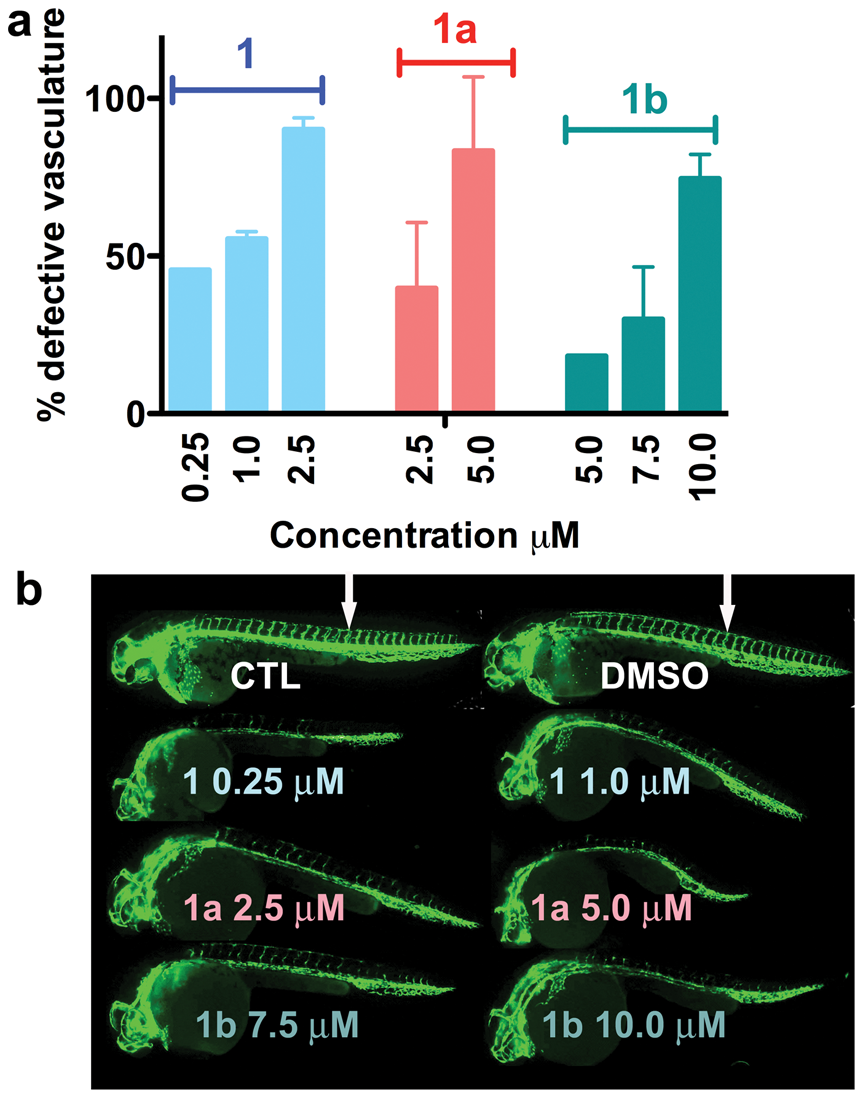
Fig. 8
Dose-dependent effects of EYA inhibitors on the developing zebrafish vasculature.
(a) Titration of compounds 1, 1a, 1b at the indicated doses. Two independent experiments were performed in most cases using 9–15 embryos per experiment at each dose; the standard error and mean values are shown. Experiments with 0.25 μM compound 1 and 5 μM compound 1b were only performed once using 10 embryos each. The y-axis shows the percentage of embryos showing any defects in vascular development (either intersegmental vessels (ISV) formation or defects in the dorsal aorta/cardinal vein). (b) Images of representative untreated control (CTL), vehicle (DMSO) treated, and EYA inhibitor treated embryos at 28–30 hpf. Note reduced or absent ISV in the inhibitor treated embryos relative to the controls (ISV in controls indicated by white arrows).