
|
Fig. 6
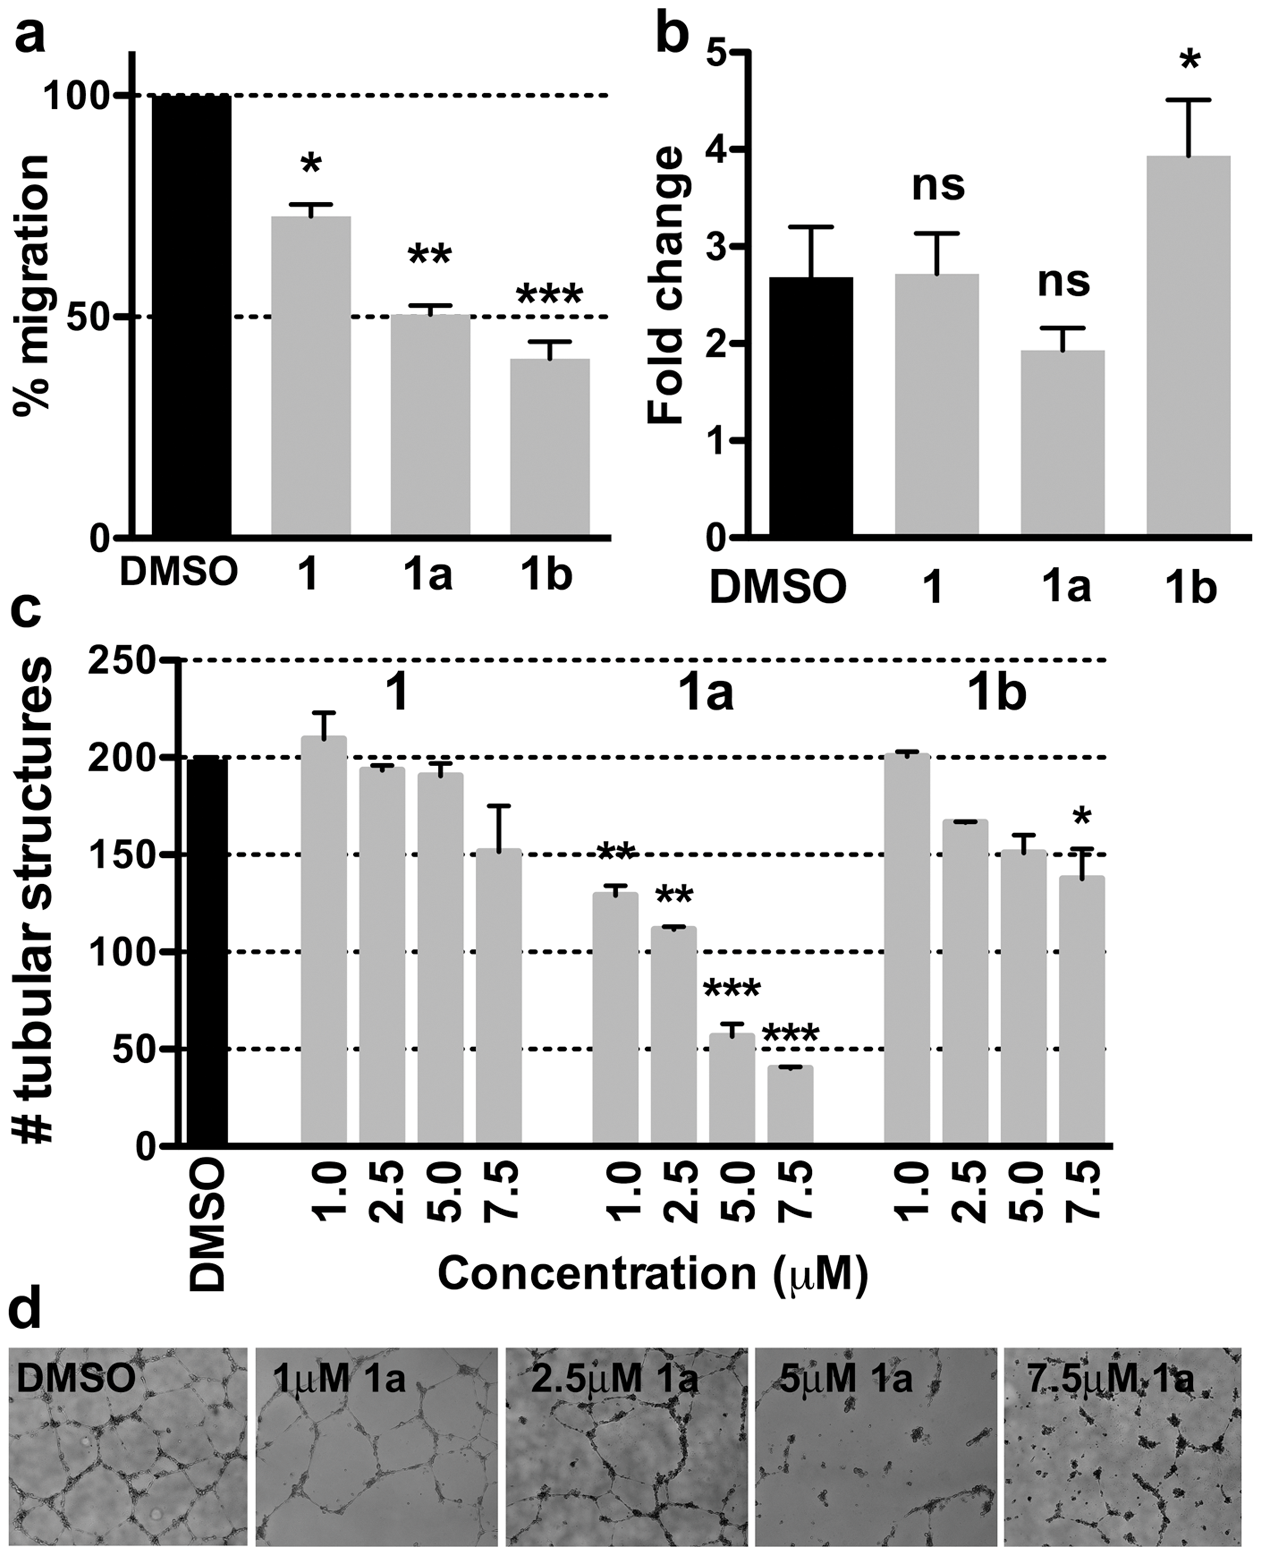
EYA inhibitors attenuate migration and tubulogenesis of HUVECs.
(a) Percent migration of HUVECs in the presence of 5 μM relative to the vehicle control?. (b) Change in cell density after 24 hours in the presence of either vehicle control (0.1% DMSO) or 5 μM of each EYA inhibitor. (c) Quantitation of the number of tube-like structures formed by HUVECs in the presence of either the vehicle control (0.1% DMSO) or the indicated concentrations of compounds 1, 1a and 1b. The number of tubes was measured using NeuroJ. Data are mean and standard error of three independent experiments. p-values from a one-way ANOVA are shown; ns is not significant, * p<0.05, ** p<0.01, *** p<0.001. (d) Representative images of HUVECs on Matrigel in the presence of the indicated doses of 1a.