
|
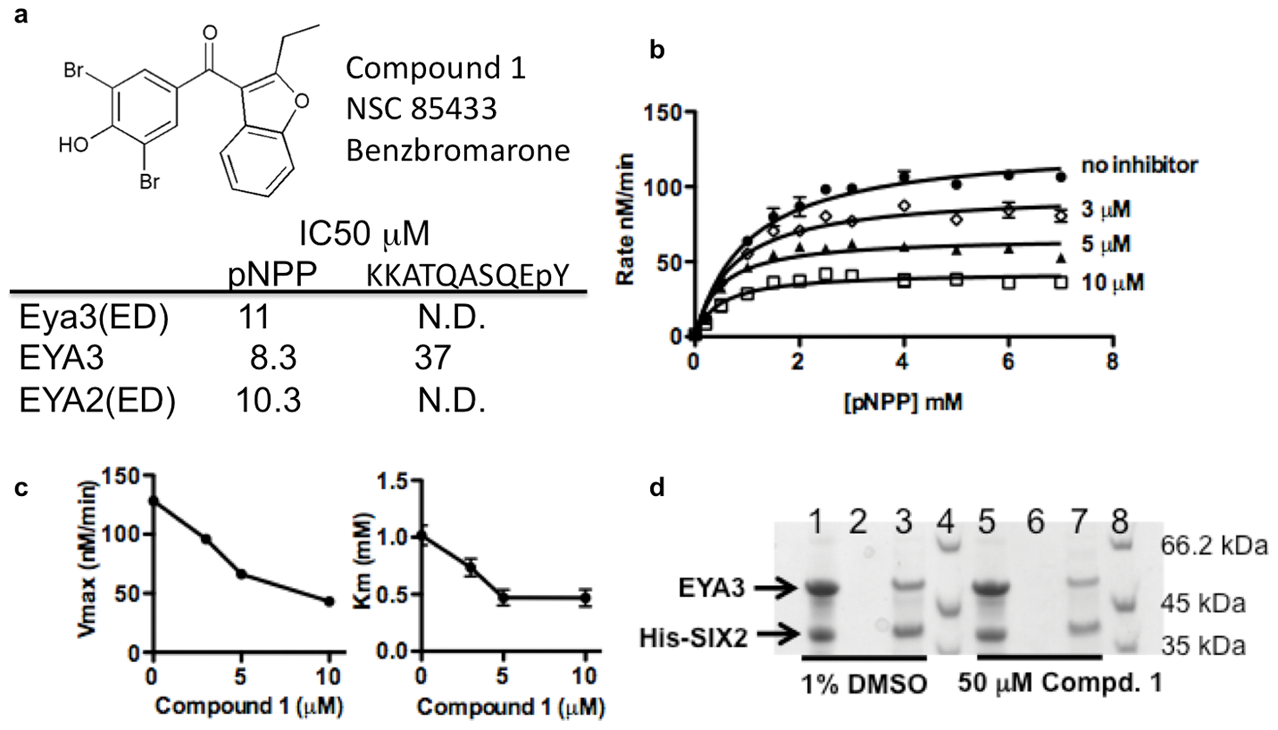
Fig. 2
EYA inhibitor Benzbromarone, compound 1.
(a) Compound 1 was identified from a screen of the NCI Diversity Set II library. IC50 values for compound 1 were measured for Eya3(ED), human EYA3 and human EYA2(ED) using as substrates the phosphotyrosine mimic pNPP and a phosphopeptide representing the last 10 amino acids of H2AX, a known EYA substrate. (b) Substrate titration shows that compound 1 is an uncompetitive inhibitor of EYA3(ED). Increasing concentration of substrate does not overcome inhibition. Each point represents the mean and standard deviation of two independent readings. (c) Plots of Vmax and Km as a function of inhibitor concentration show that both values decrease with increased inhibitor concentration. Values in (c) were derived from nonlinear regression analyses of curves in (b) using PRISM (GraphPad Software). (d) Compound 1 does not affect the interaction between EYA3 and SIX2. Recombinant purified EYA3 and His-SIX2 were mixed and treated with either the vehicle control (1% DMSO) (lane 1) or 50 µM compound 1 (lane 5) for 15 minutes at room temperature. The mixture was loaded on a Ni-NTA column. Beads were washed with 3 column volumes of load buffer (last washes, lanes 2 and 6). Proteins retained on the beads are shown in lanes 3 and 7. Lanes 4 and 8 are molecular weight markers.