
|
Fig. 1
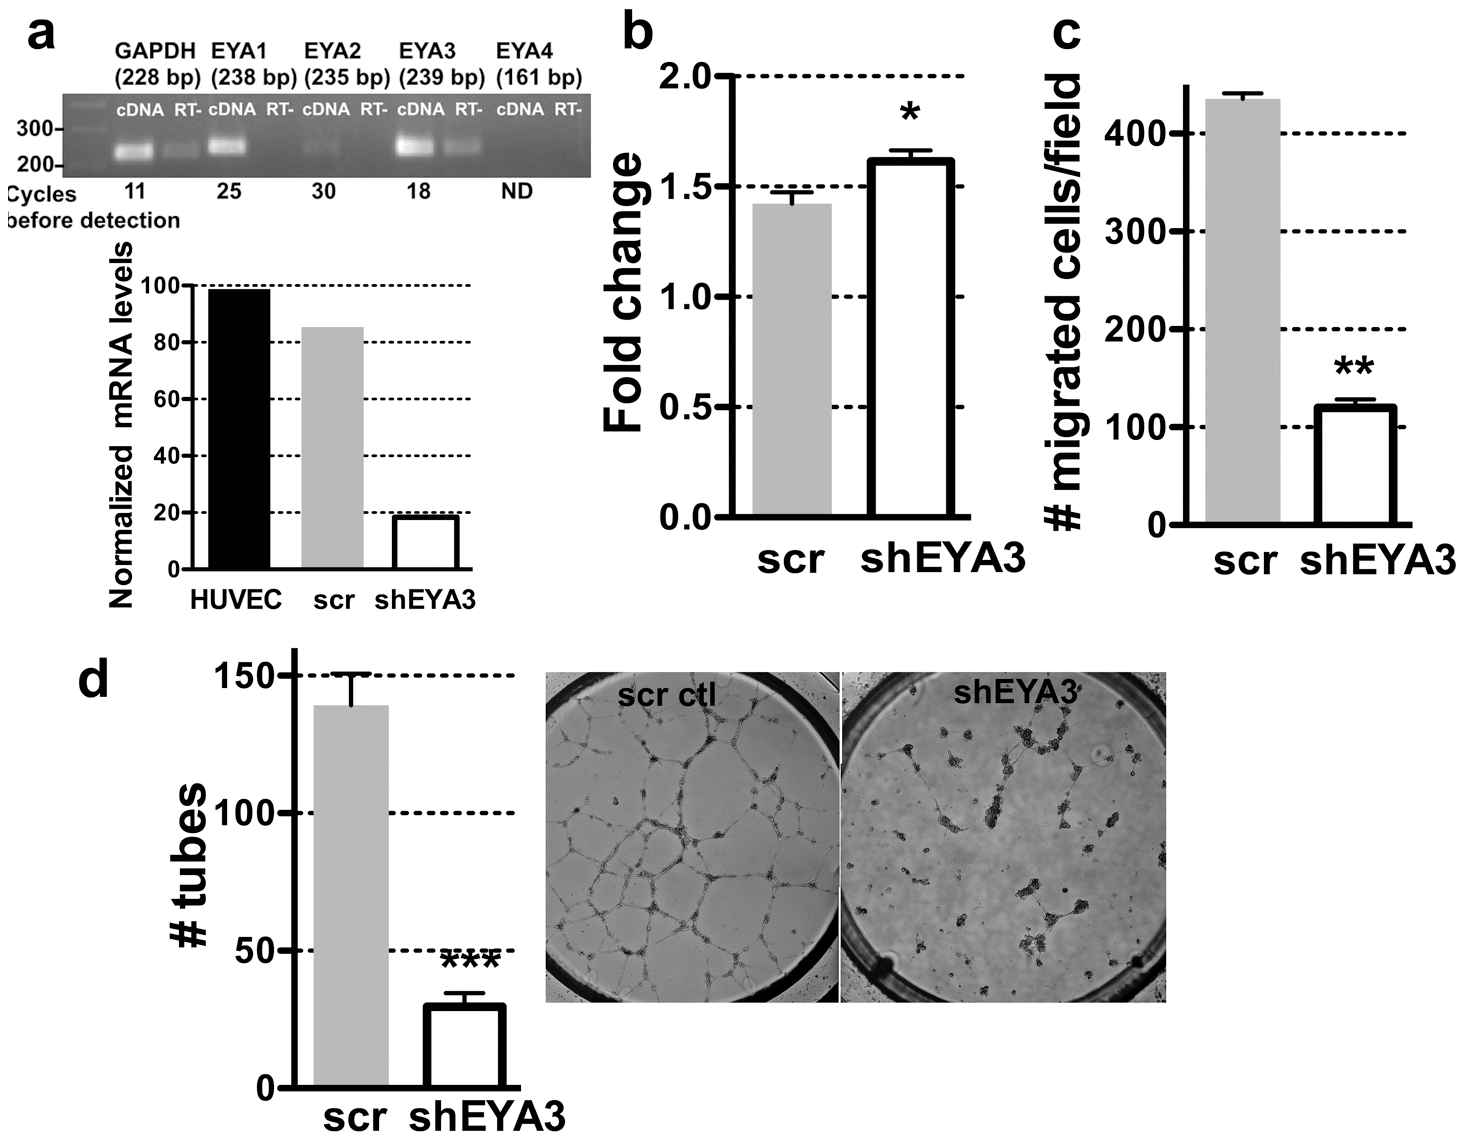
EYA3 knockdown in HUVECs attenuates single cell motility and capillary morphogenesis.
(a) Expression of Eya transcripts in HUVECs. Real-time PCR product was analyzed at saturation (cycle 45) on a 1.5% agarose gel to confirm that amplified products were of the expected sizes. Indicated are the numbers of amplification cycles after which each signal was detectable; EYA4 was not detected (ND) after 45 cycles of amplification. RT- stands for cDNA from a reaction without reverse transcriptase. Graph below show the results of quantitative RT-PCR on HUVECs transduced with lentivirus scramble control RNA or shEYA3. (b) Change in cell density of HUVECs-scramble control and HUVEC-shEYA3 after 24 hours shows a small but significant increase when EYA3 levels are reduced. (c) Transwell migration of HUVEC-scramble control and HUVEC-shEYA3 shows a significant reduction in motility when EYA3 levels are reduced. (d) Capillary morphogenesis on matrigel was assayed using HUVEC-scramble control and HUVEC-shEYA3. A significant reduction in tube formation was seen when EYA3 levels were lowered. In each case the bars represent the mean and standard error of three experiments. The p-values were calculated by one-way ANOVA followed by a Tukey post test. ns is not significant, * p<0.05, ** p<0.01, *** p<0.001. In each case the p value shown is relative to the scramble-control.