
Image
|
Figure Caption
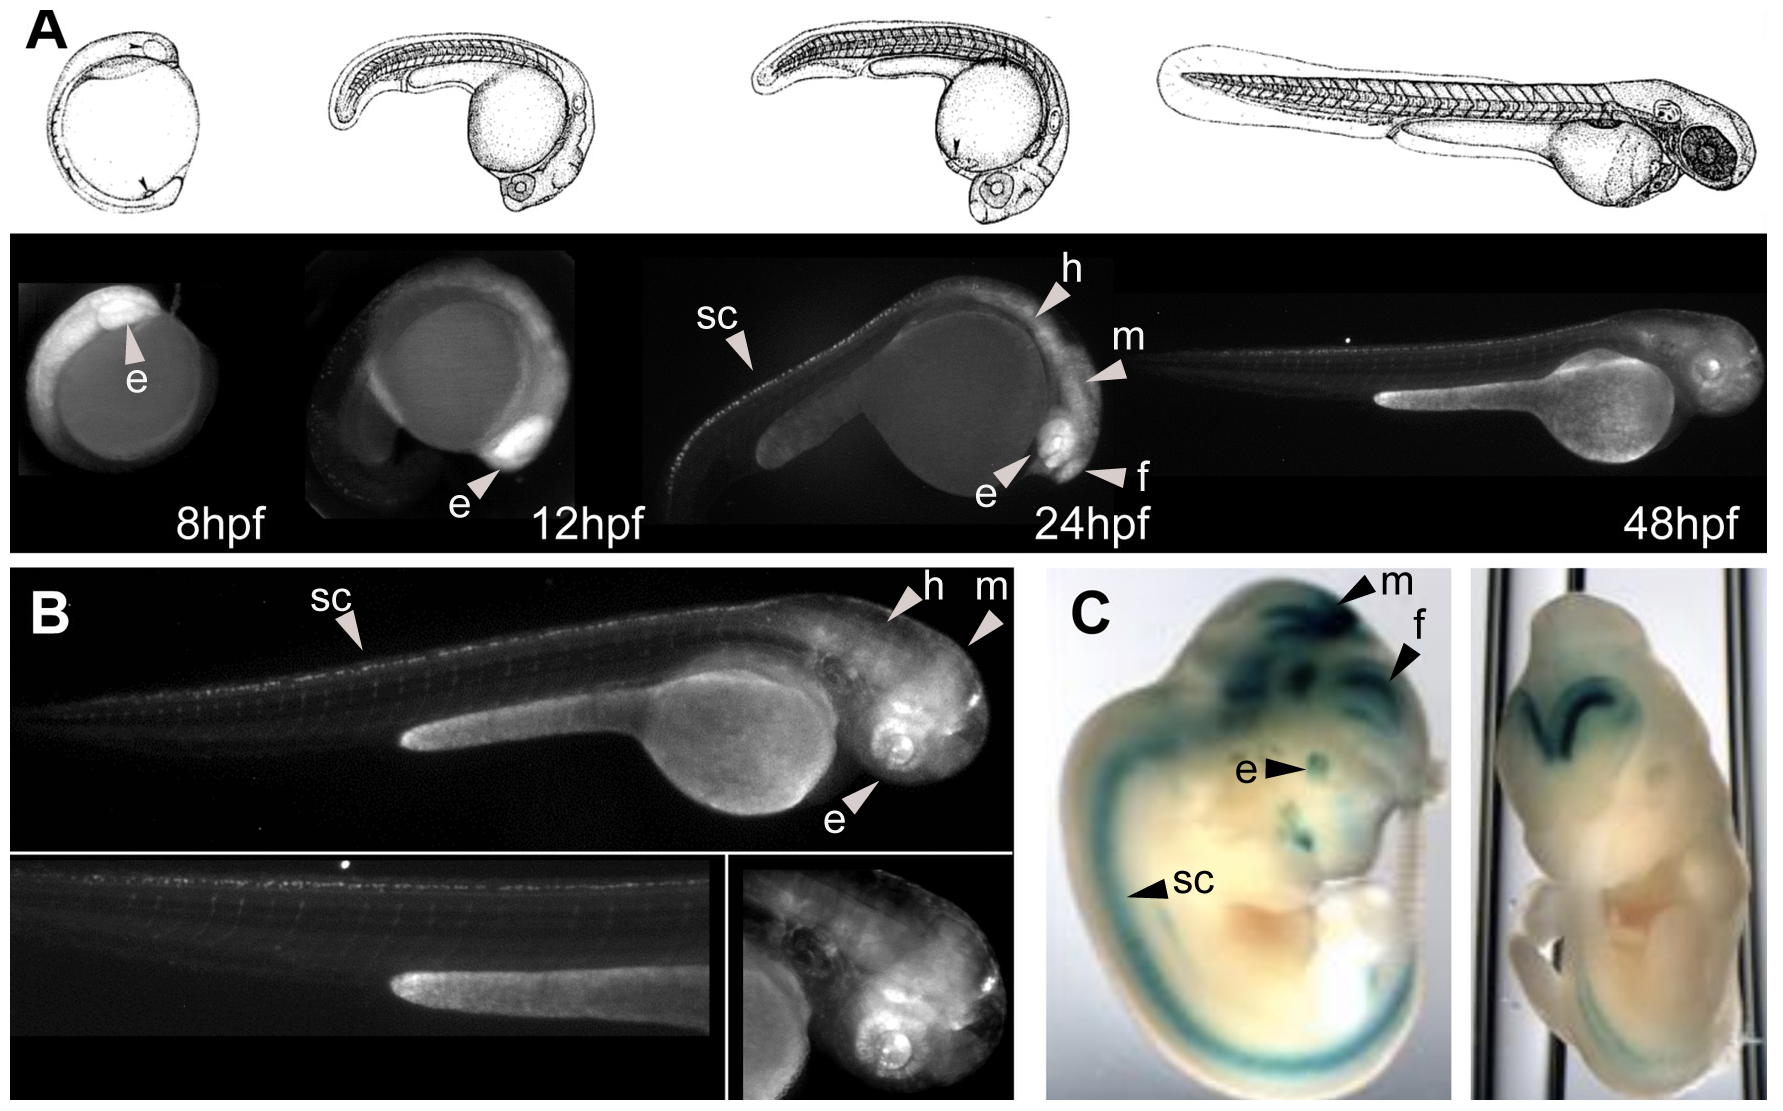
Fig. 4
Enhancer assays in zebrafish allow a detailed spatiotemporal characterization of the expression patterns.
A) Illustration of the first 48 hpf development of the zebrafish (upper panel). In the lower panel, EGFP expression of HCNR C81 during the first 48 hpf. B) Detailed EGFP expression of the HCNR C81 at 48 hpf. The same CNR was as assayed (Vista browser element37, http://pipeline.lbl.gov/cgi-bin/gateway2). Abbreviations are: eye (e), forebrain (f), midbrain (m), hindbrain (h) and spinal cord (sc).
Acknowledgments
This image is the copyrighted work of the attributed author or publisher, and
ZFIN has permission only to display this image to its users.
Additional permissions should be obtained from the applicable author or publisher of the image.
Full text @ PLoS One