Fig. 3
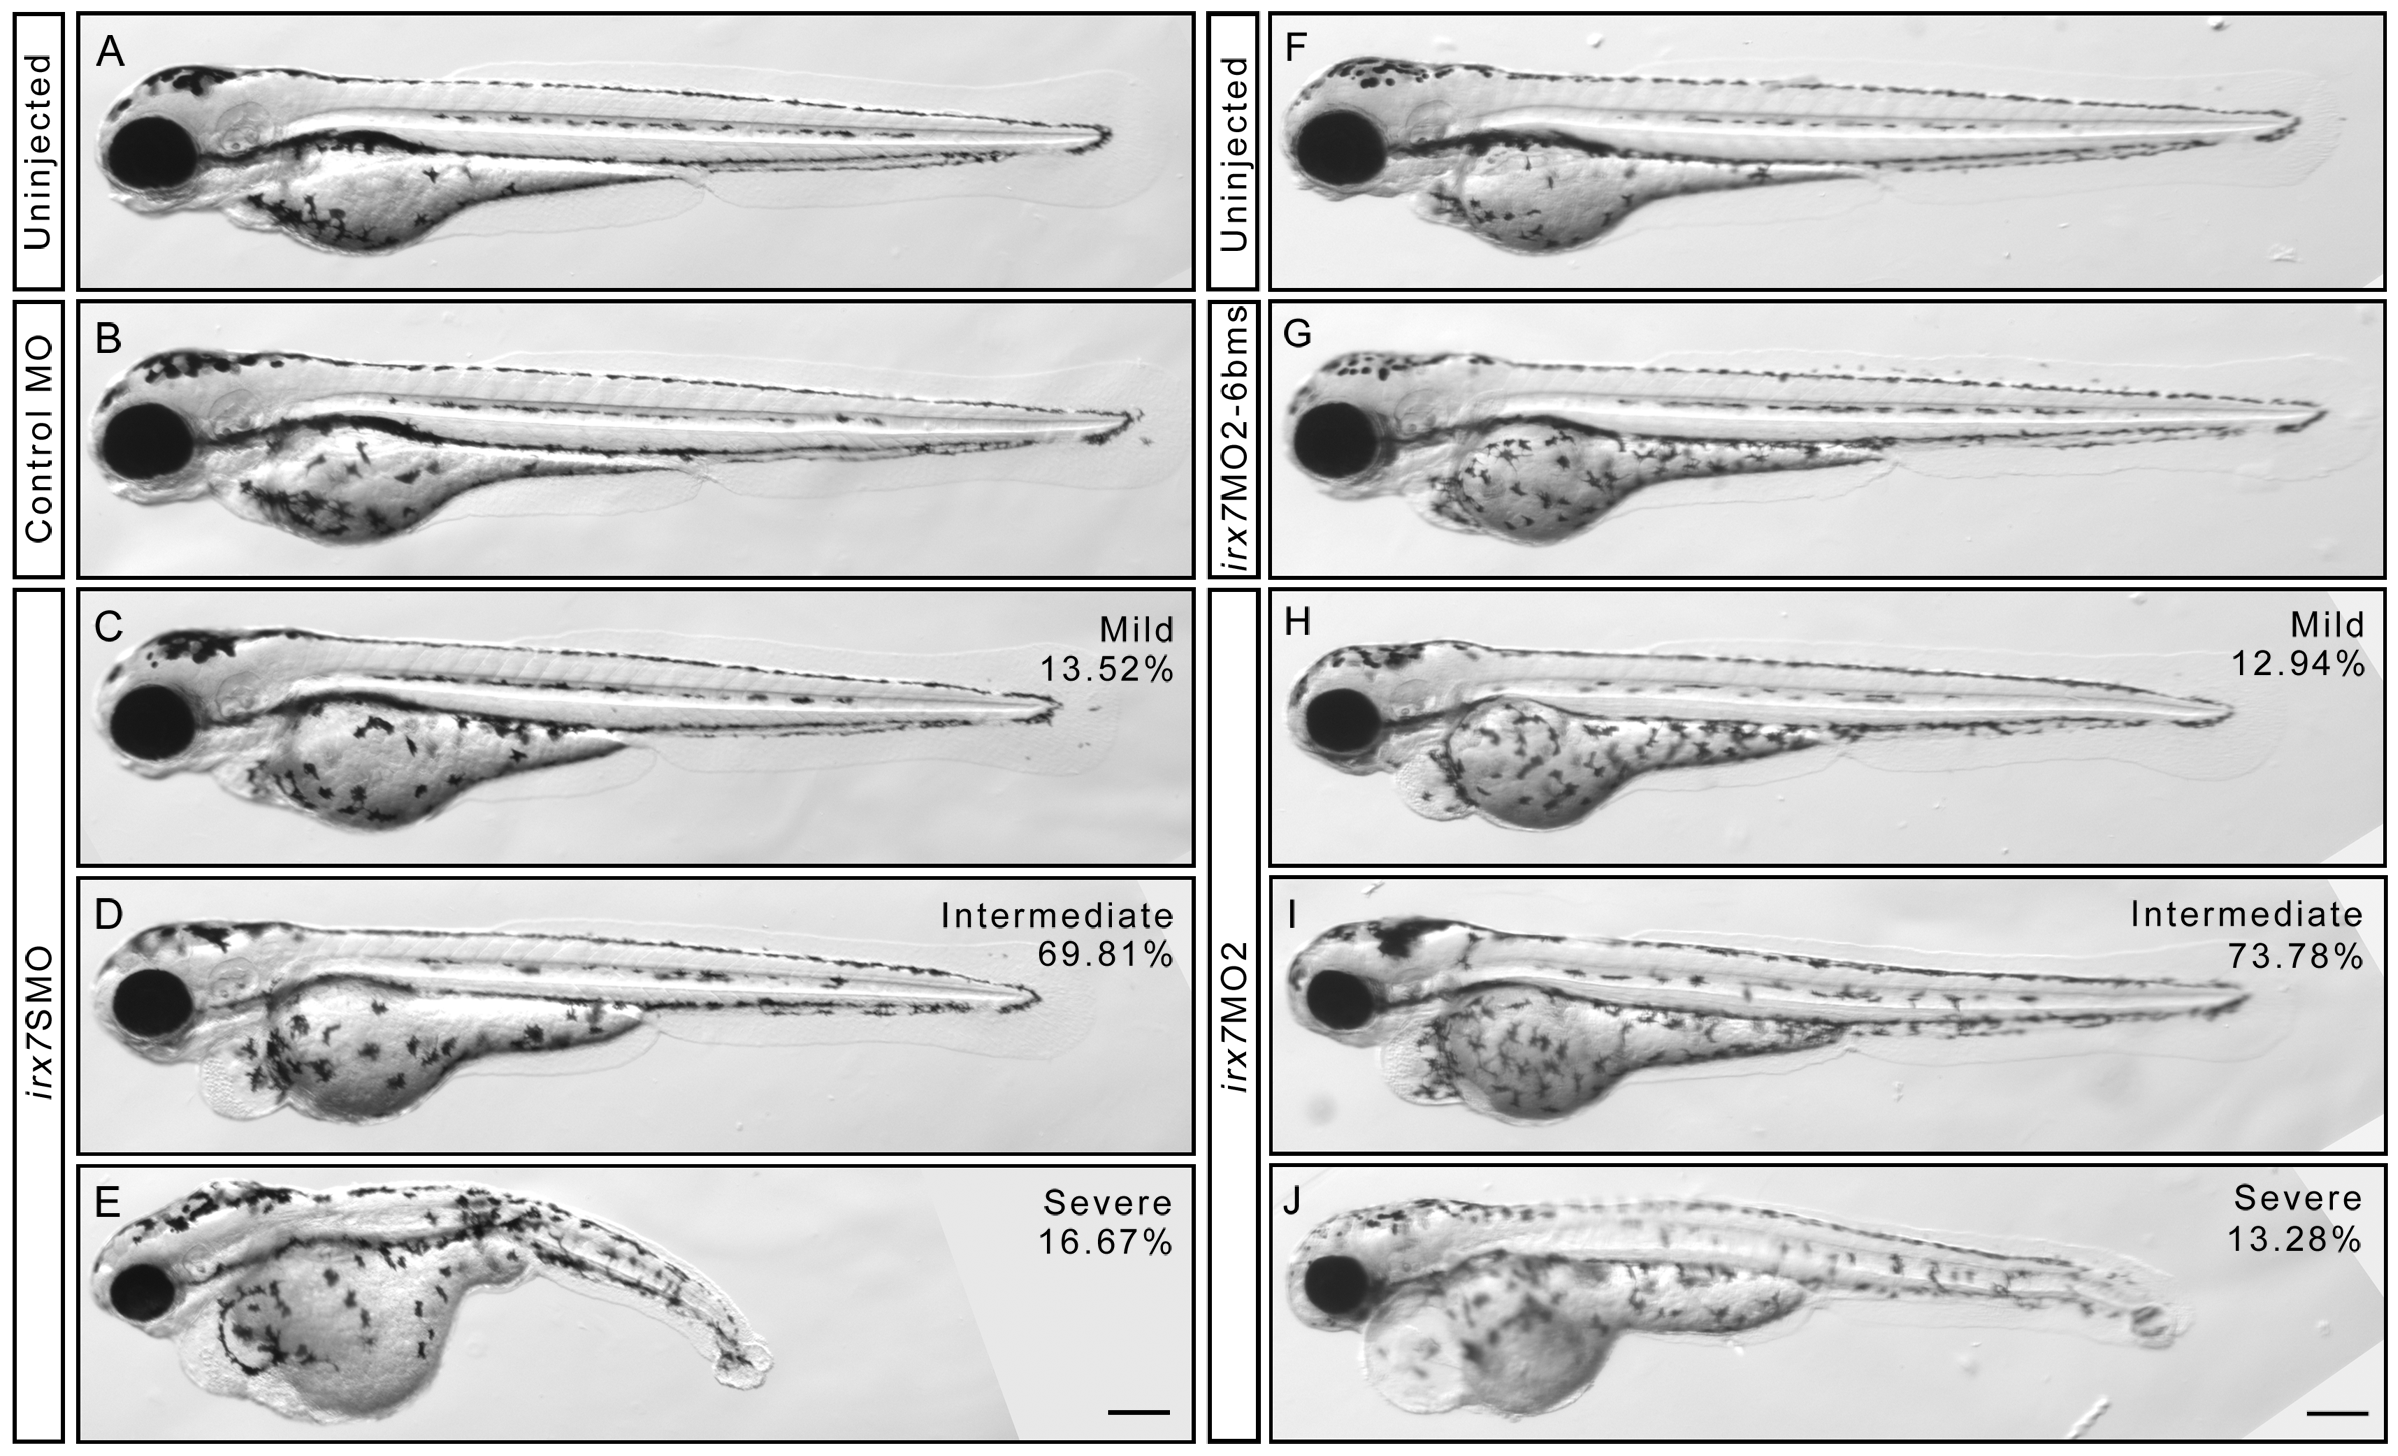
The phenotypes of irx7SMO and irx7MO2 morphants at 72 hpf.
Phenotypic analysis of the optimized irx7SMO (A–E) and irx7MO2 (F–J) injection experiments. (A) The lateral view of an uninjected control embryo for irx7SMO injection experiments. (B) An embryo injected with 10 ng of Control MO. (C–E) Three phenotypic categories of the morphants after injected with 10 ng of irx7SMO. The percentage of embryos that had mild (C), intermediate (D) and severe (E) phenotypes was 13.52% (N = 106), 69.81% (N = 444) and 16.67% (N = 86) respectively. (F) The lateral view of an uninjected control embryo for irx7MO2 injection experiments. (G) An embryo injected with 3 ng of irx7MO2-6 bms. (H–J) Three phenotypic categories of morphants after injected with 3 ng of irx7MO2. The percentage of embryos that had mild (H), intermediate (I), and severe (J) phenotypes were 13.28% (N = 38), 73.78% (N = 211) and 12.94% (N = 37) respectively. Scale bar = 200 μm.

