
|
Fig. S3
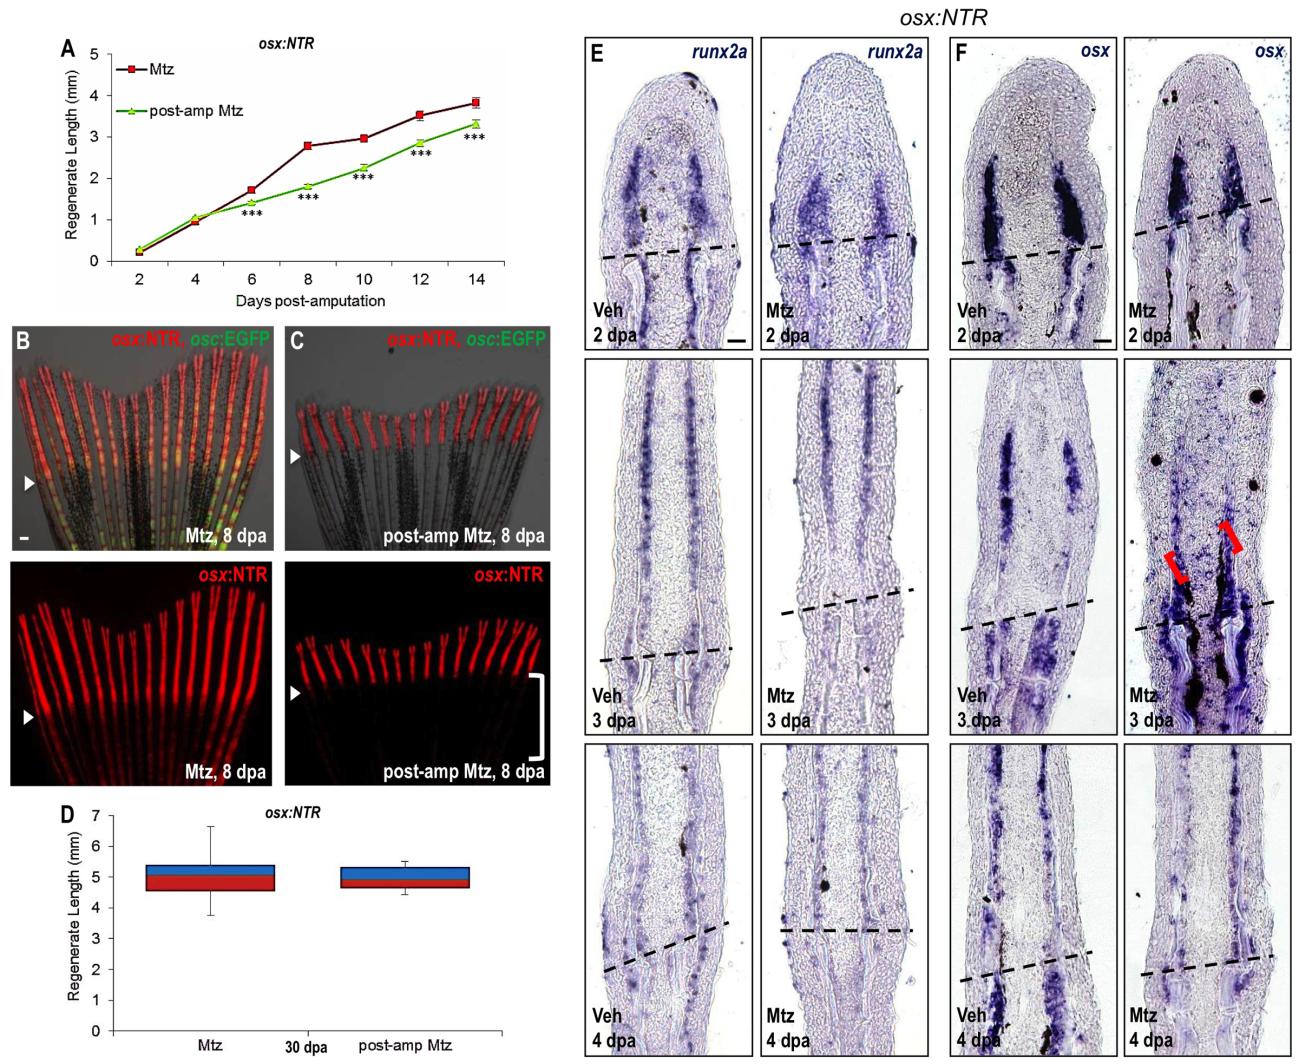
Induction of the Early Osteoblast Marker runx2a in the Regenerate after Ablation
(A) osx:NTR animals treated with vehicle before amputation and with Mtz 4 days after amputation (post-amp Mtz) display a slower rate of regeneration as compared to those treated with Mtz 2 days before amputation (Mtz). An additional control group, showing normal regeneration and not indicated on this graph, was wild-type animals treated with Mtz 2 days before amputation and 4 days after amputation (see Figure 3B). These data indicate that osteoblast ablation during regeneration slows the process. Data are mean ± SEM from 15 animals each. ***p < 0.001, Student’s t-test.
(B, C) Images of 8 dpa osx:NTR; osc:EGFP fin regenerates treated with Mtz at 2 days before amputation (B) or at 4 dpa (C). Post-amputation treatment slows regeneration. osx:NTR fluorescence is strong in the 8 dpa regenerate from the post-amputation Mtz group, but not yet detectable in the uninjured portions proximal to the amputation plane (bracket in (C)). Arrowheads indicate amputation plane. Scale bar = 100 μm.
(D) Lengths of regenerates at 30 dpa from different treatment regimens are similar, indicating that pre- or post-amputation ablation of osteoblasts does not alter the correct recovery of proximodistal length. Data are mean ± SEM from 15 animals each.
(E, F) Longitudinal sections of 2, 3, and 4 dpa fin regenerates indicating runx2a (E) and osx (F) mRNA expression. runx2a and osx is detected both proximal and distal to the amputation plane (dotted lines) in osx:NTR fish treated with vehicle prior to amputation (left panels for each marker in E, F). By contrast, after treatment with Mtz to ablate osteoblasts prior to amputation (right panels), runx2a and osx are robust in the regenerate but undetectable in tissue proximal to the amputation plane. Additionally, osx expression is detected in intraray fibroblasts at 3 dpa regenerates of fins that had been depleted of osteoblasts prior to amputation (red bracket). Scale bar = 100 μm.
Reprinted from Developmental Cell, 22(4), Singh, S.P., Holdway, J.E., and Poss, K.D., Regeneration of amputated zebrafish fin rays from de novo osteoblasts, 879-886, Copyright (2012) with permission from Elsevier. Full text @ Dev. Cell