
|
Fig. 3
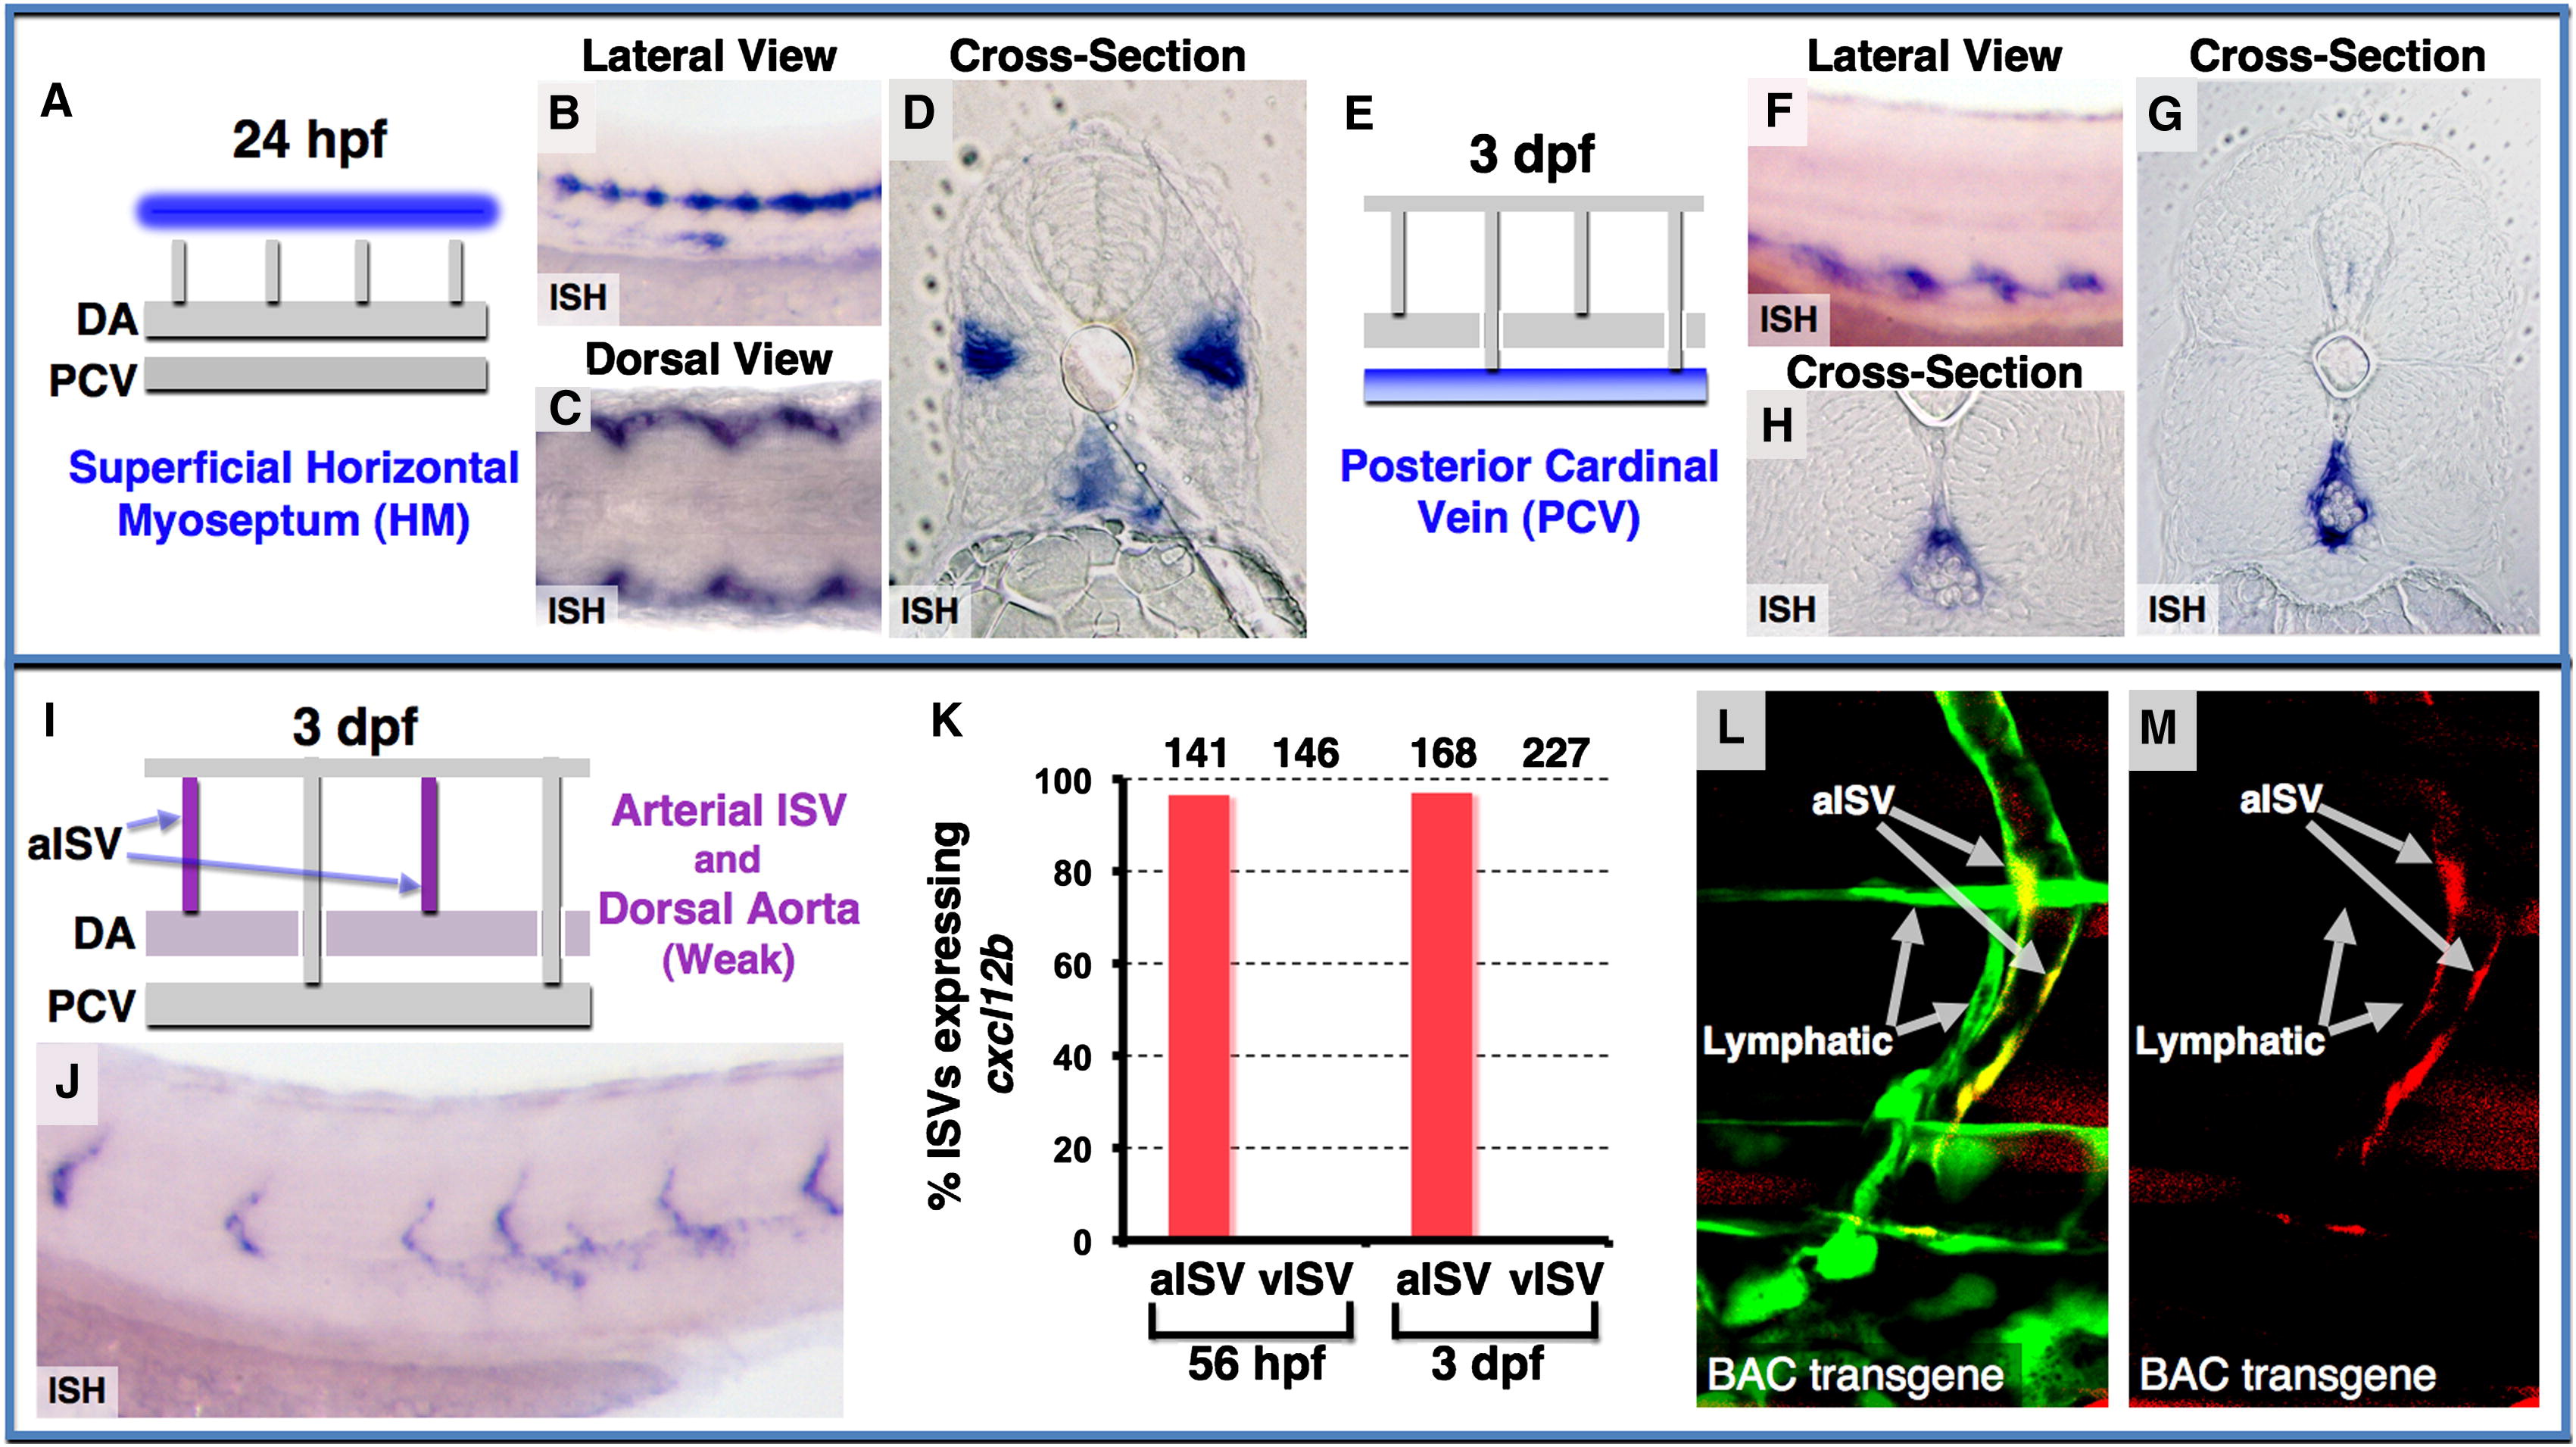
Chemokine Ligand Cxcl12 Expression in the Developing Zebrafish Trunk (A–D) Cxcl12a expression in the superficial HM at 24 hpf, as shown in diagram (blue in A), and in WISH lateral view (B), dorsal view (C), and cross-section (D). (E–H) Cxcl12a expression in the PCV at 3 dpf, as shown in diagram (blue in E), and in WISH lateral view (F) and cross-sections (G and H). (I and J) Cxcl12b expression in the aISV and DA, as shown in diagram (magenta in I) and in WISH lateral view image (J) at 3 dpf. (K) Quantification of aISV and vISV (determined by direction of blood flow and by connection to either the DA or PCV as shown in Movie S2) expressing cxcl12b at 56 hpf and 3 dpf. Numbers of counted aISVs or vISVs at each time point are indicated above the bars. (L and M) Confocal images of mid-to-ventral trunk vessels in a 3 dpf Tg(fli1a:EGFP)y1 embryo (green) injected with a recombineered BAC clone with TagRFP-T driven by the cxcl12b promoter (red), showing green and red fluorescence together (L), or red fluorescence only (M). TagRFP-T expression is present in aISVs, but not in adjacent LVs. See also Figure S3.
Reprinted from Developmental Cell, 22(4), Cha, Y.R., Fujita, M., Butler, M., Isogai, S., Kochhan, E., Siekmann, A.F., and Weinstein, B.M., Chemokine Signaling Directs Trunk Lymphatic Network Formation along the Preexisting Blood Vasculature, 824-836, Copyright (2012) with permission from Elsevier. Full text @ Dev. Cell