
|
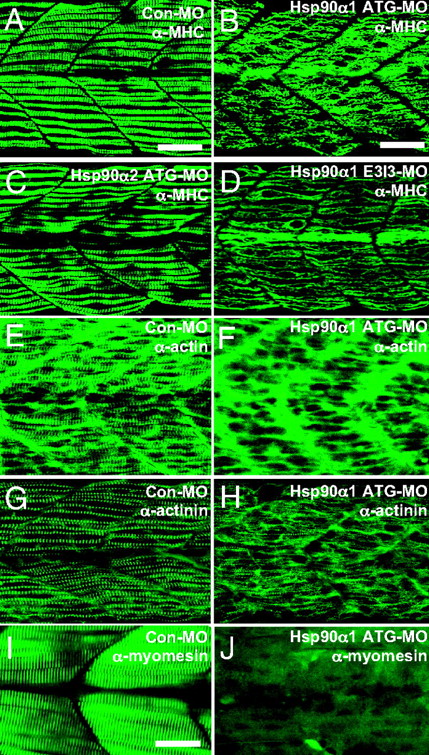
Fig. 3
Knockdown of Hsp90α1 expression resulted in myofibril disorganization in skeletal muscles of zebrafish embryos. (A and B) Anti-MHC antibody (F59) staining shows the organization of thick filaments in trunk slow muscles of control-MO (A) or Hsp90α1-ATG-MO (B) injected embryos at 24 hpf. (C and D) Anti-MHC antibody (F59) staining shows the organization of thick filaments in trunk slow muscles of Hsp90α2 ATG-MO (C) or Hsp90α1-E3I3-MO (D) injected embryos at 24 hpf. (E and F) Anti-actin antibody staining shows the organization of thin filaments in control-MO (E) or Hsp90α1-ATG-MO (F) injected embryos at 24 hpf. (G and H) Anti-α-actinin antibody staining shows the organization of the Z-line in control-MO (G) or Hsp90α1-ATG-MO (H) injected embryos at 24 hpf. (I and J) Anti-myomesin antibody staining shows the organization of the M-line in control-MO (I) or Hsp90α1-ATG-MO (J) injected embryos at 72 hpf. (Scale bars: A and B, 25 μm and I, 15 μm.)