
|
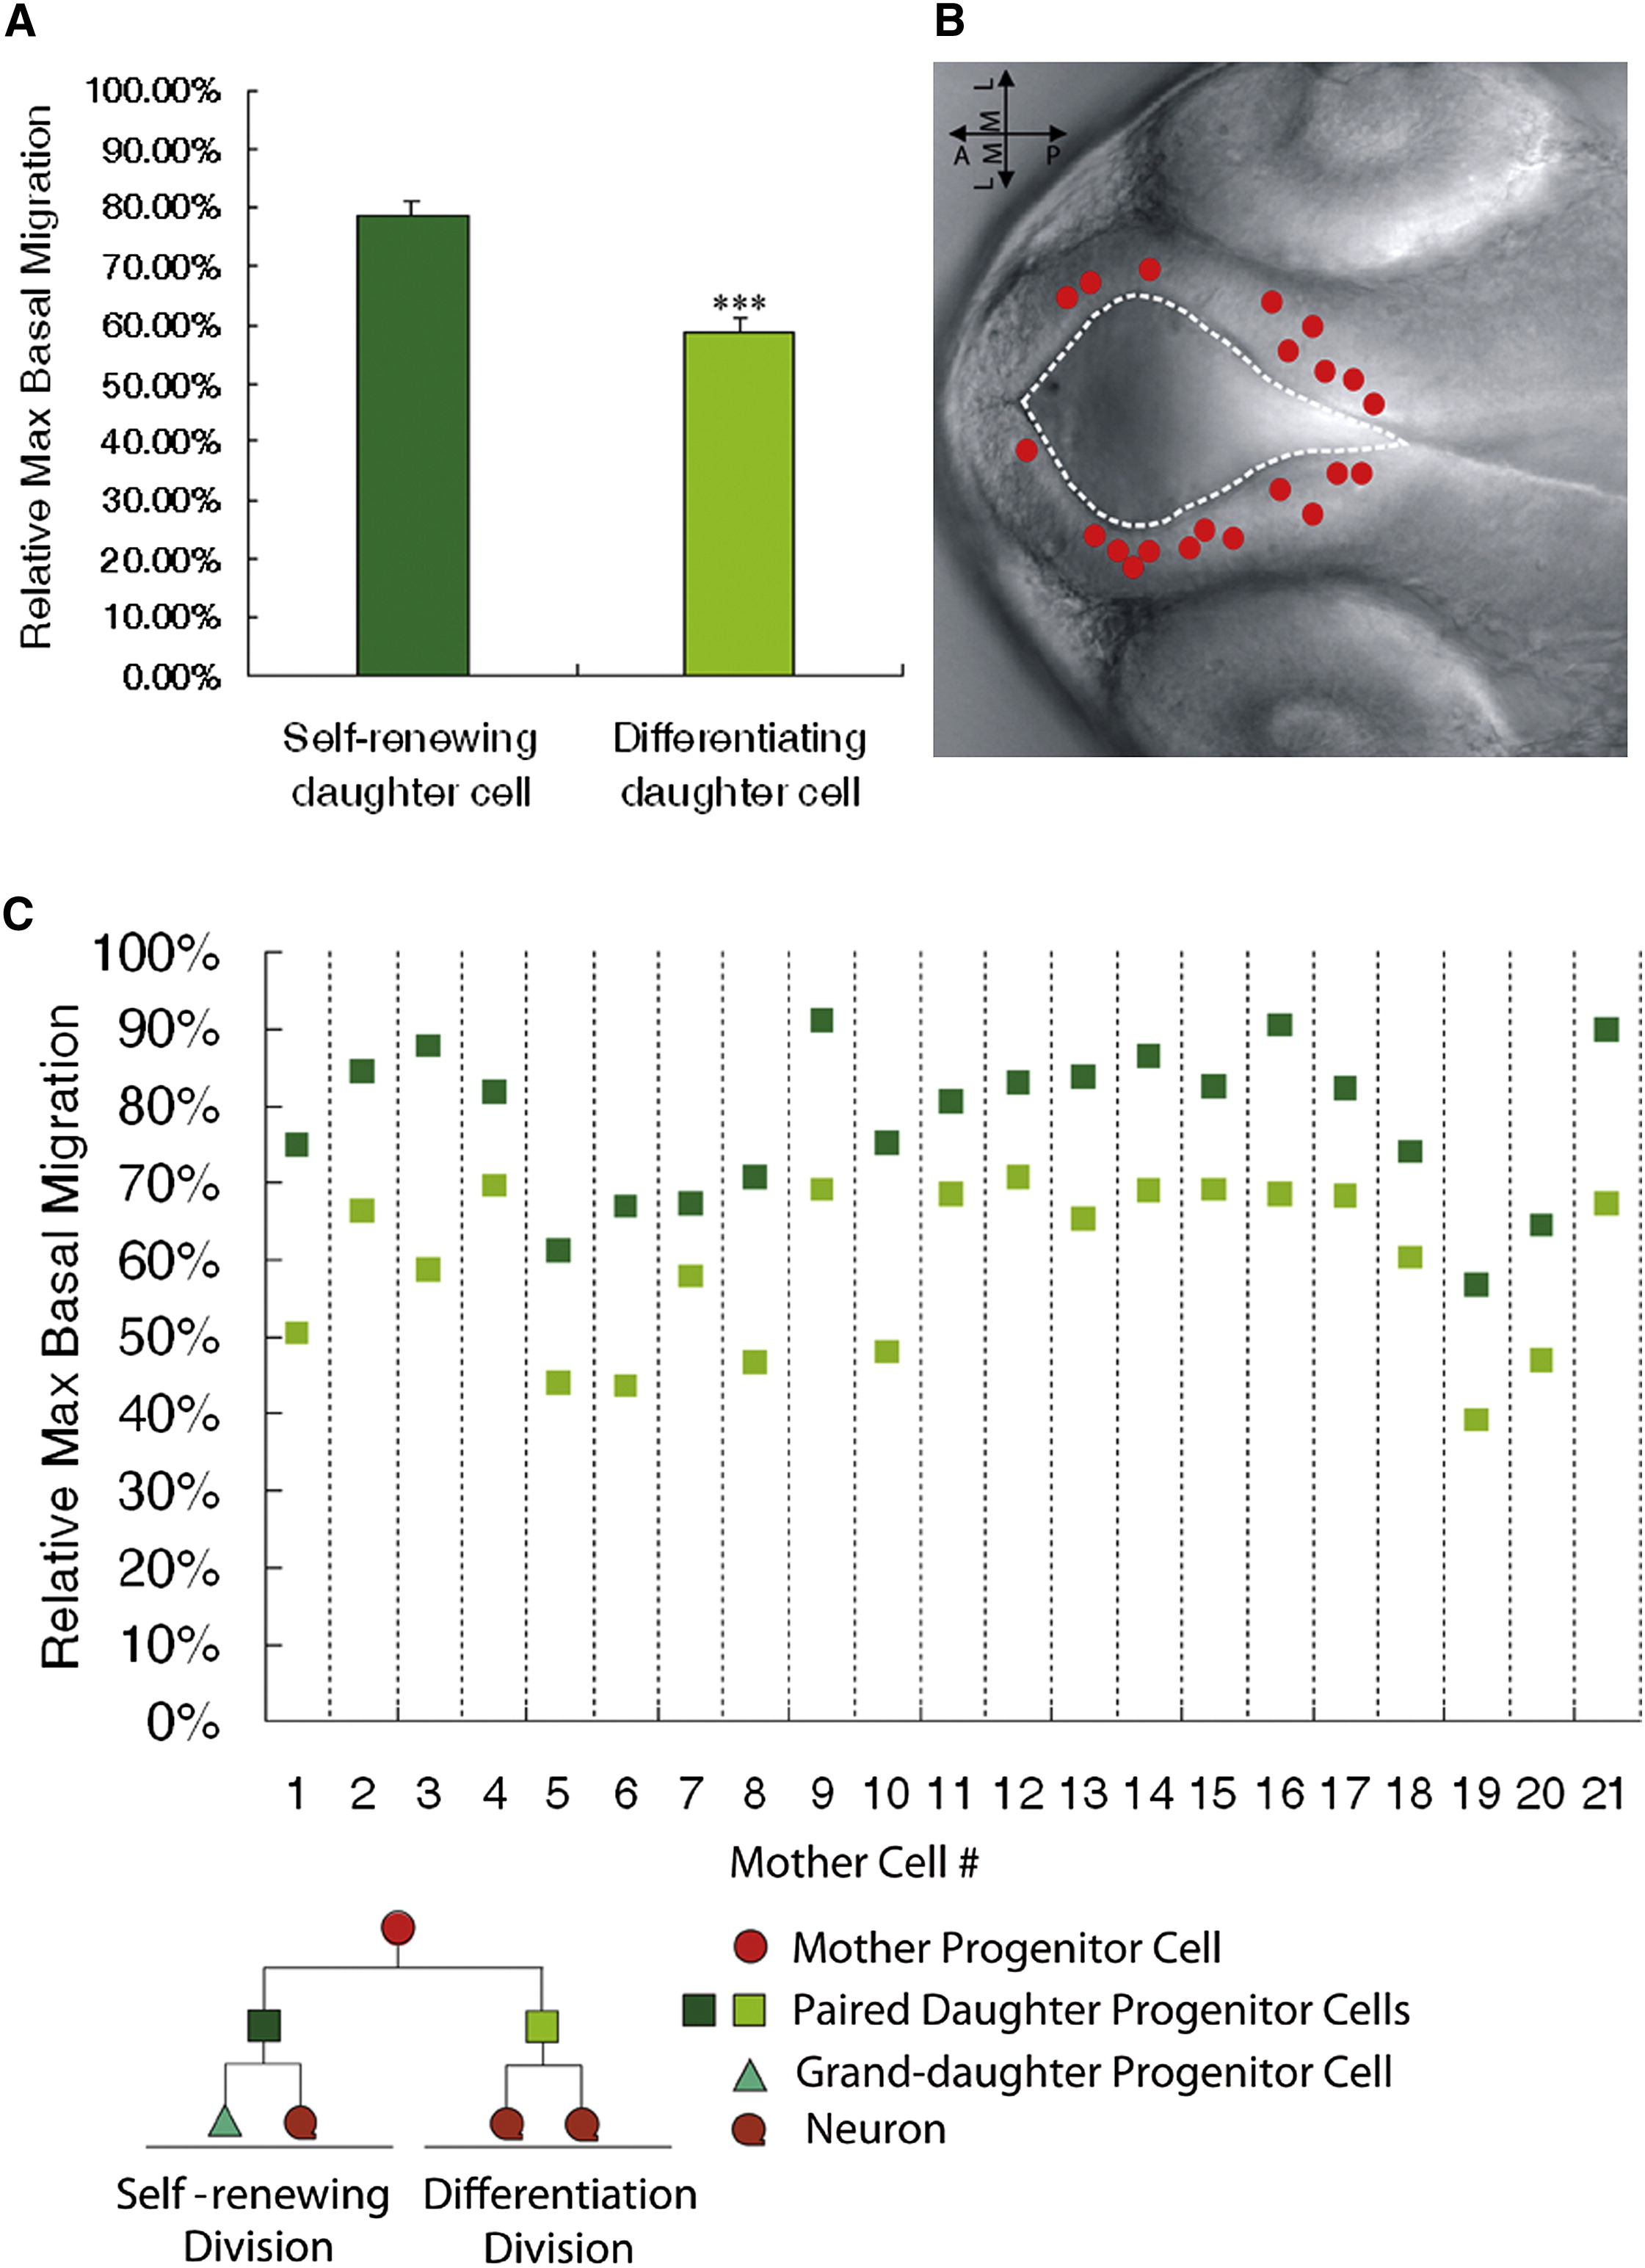
Fig. 2
In Vivo Time-Lapse Imaging Coupled with Clonal Analyses Reveals that the Self-Renewing Daughter Cell Migrates More Basally than the Differentiating Sibling(A) Quantification of the relative maximum basal migration of the self-renewing and differentiating siblings in paired daughter cells. ***p < 0.001, t test. Data are shown as the mean ± SEM.(B) Nomarski image of zebrafish forebrain depicting the location of the mother cells giving rise to the 21 paired daughter cells (red circles) that show different cell fates.(C) Relative maximum basal migration of the self-renewing daughter cell (dark green) and the differentiating daughter cell (light green).See also Figure S2.