
|
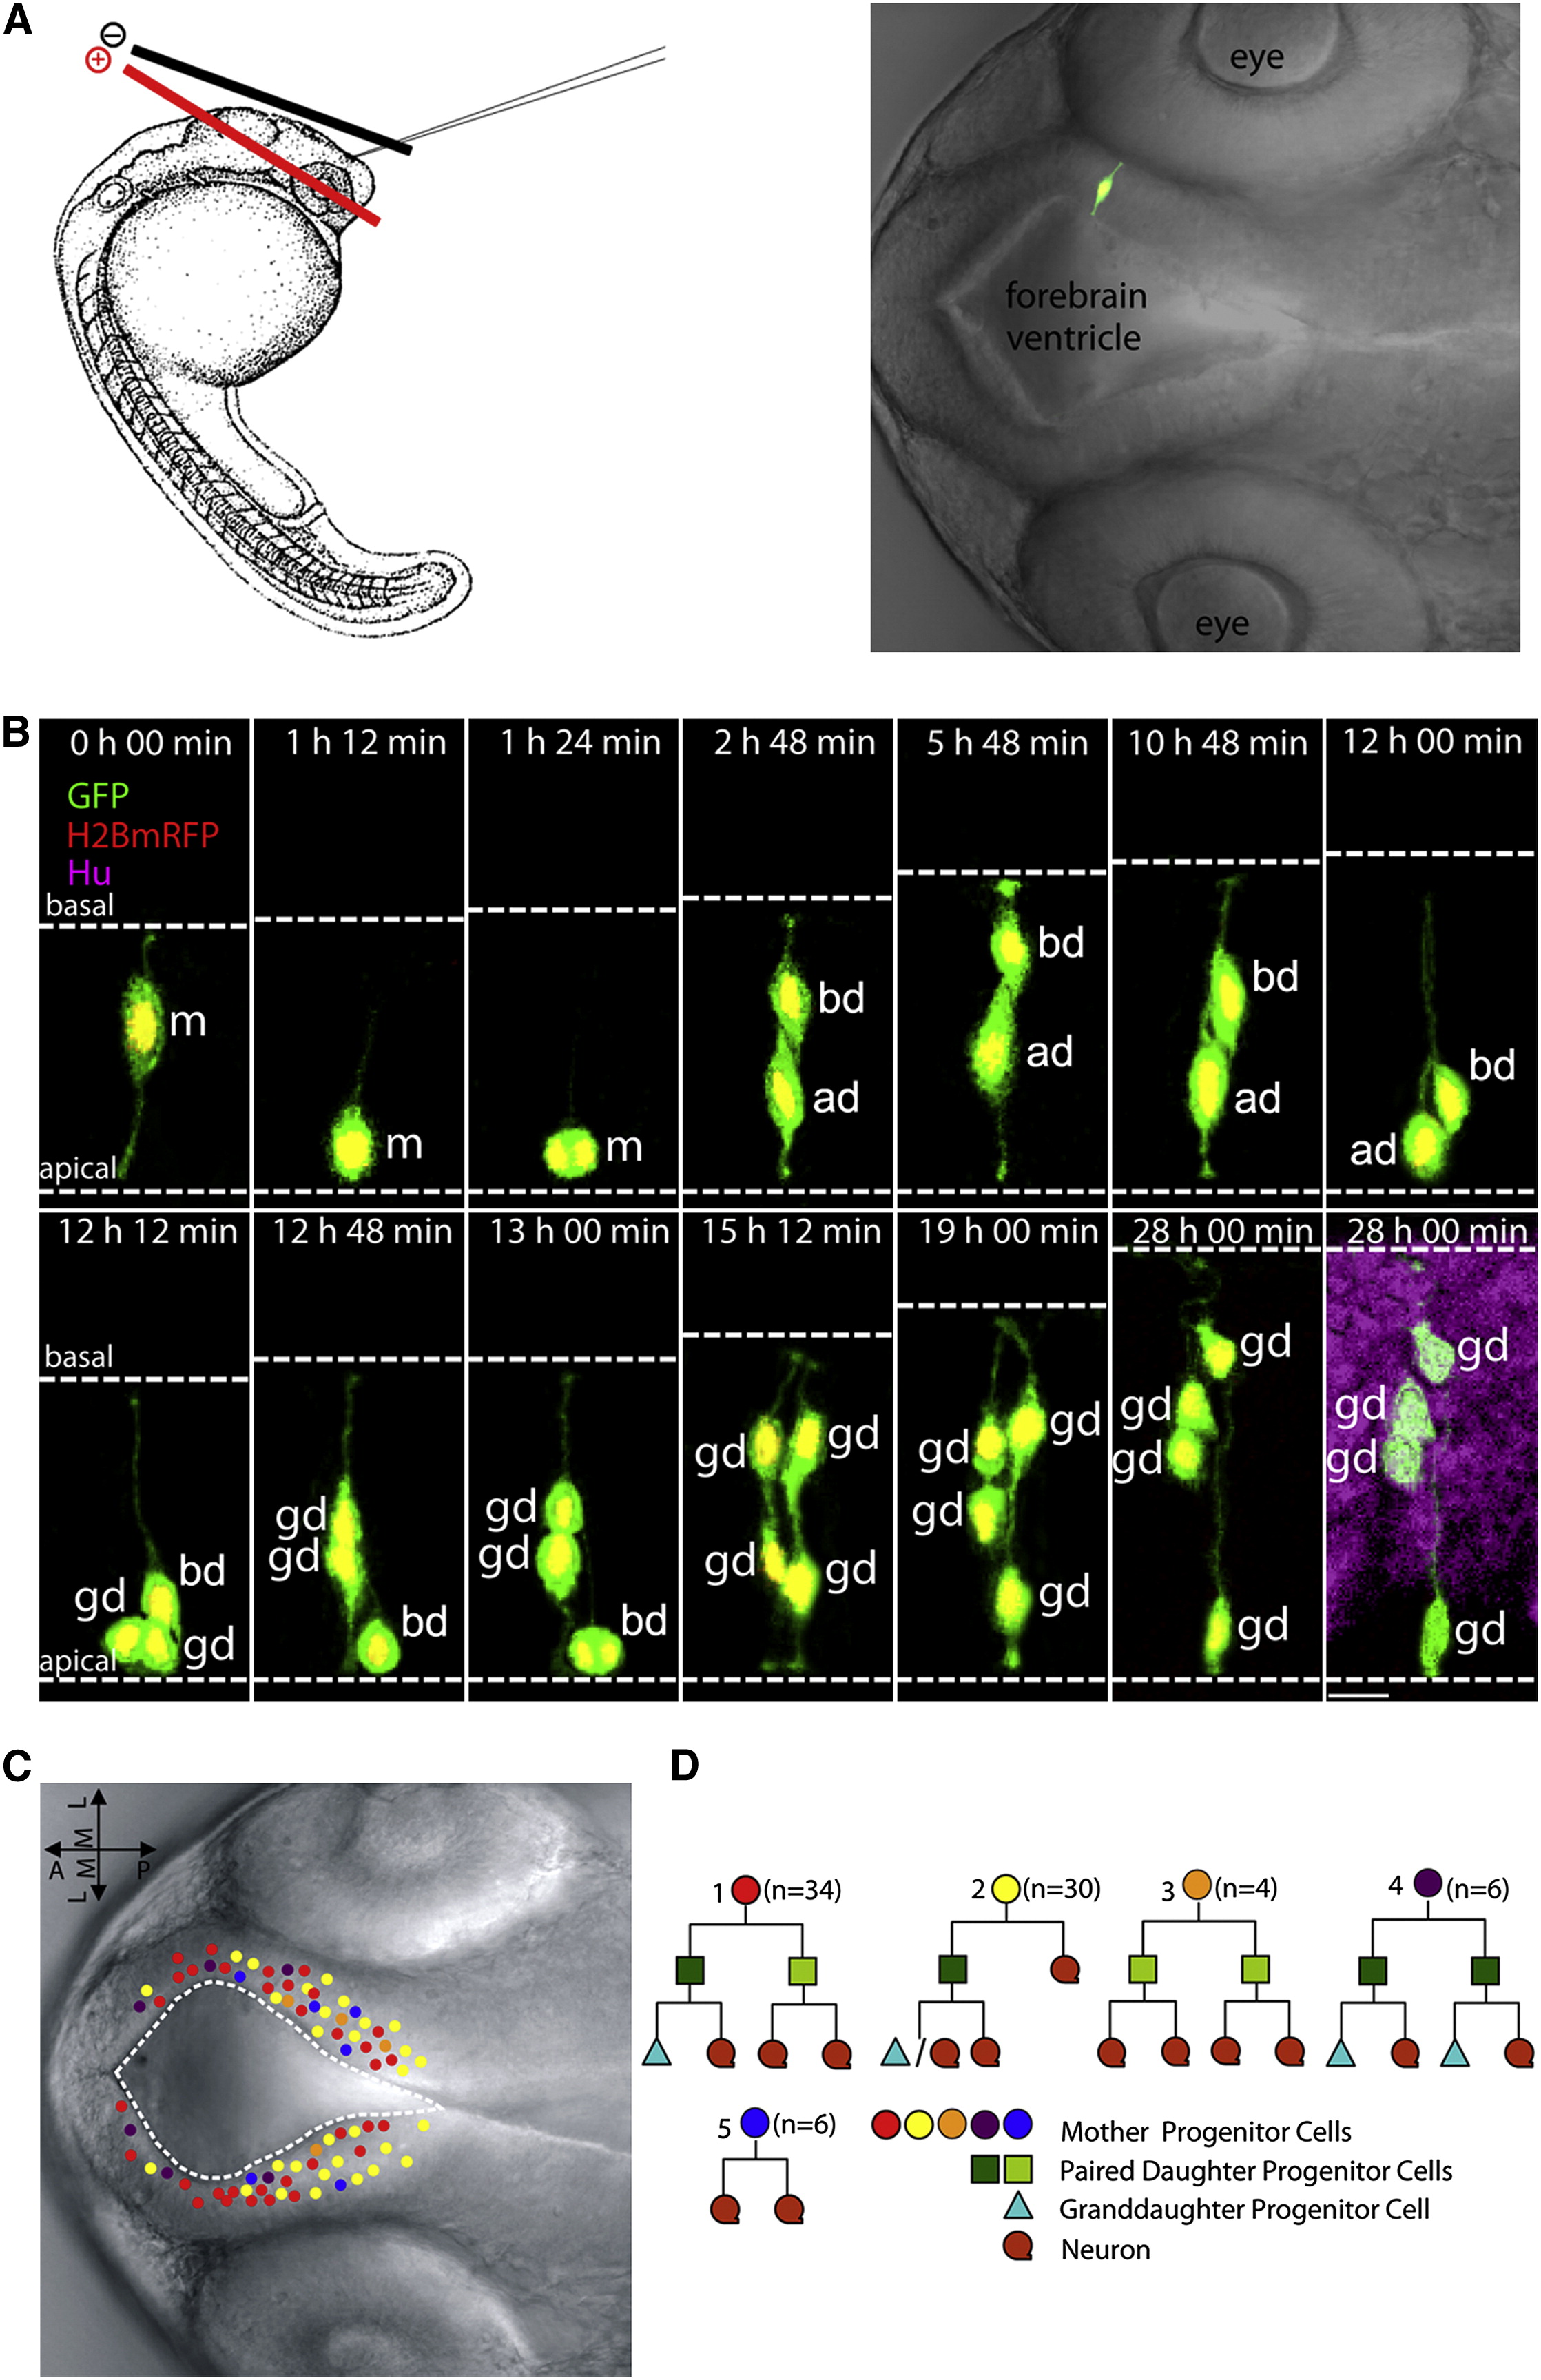
Fig. 1
In Vivo Time-Lapse Imaging of Radial Glial Progenitor Cells in the Developing Zebrafish Forebrain Delineates Self-Renewal and Differentiation Divisions.(A) Left view is a schematic of electroporation. Right view is a representative image of a labeled individual radial glia cell in 28 hpf zebrafish forebrain.(B) Representative montage of selected images from time-lapse in vivo imaging of a single fluorescently labeled mother cell. The daughter cell on the left undergoes a differentiation division (generating two neurons), whereas the daughter cell on the right undergoes a self-renewal division (generating one progenitor and one neuron). Dashed white lines indicate the apical (bottom) and basal (top) surfaces. Time is shown on the top of each panel. Zero (0) hr 00 min equals the onset of time-lapse in vivo imaging (28 hpf). m, mother cell; ad, apical daughter cell, which maintains a more apical position; bd, basal daughter cell, which migrates to and maintains a more basal position; gd, granddaughter cells. Scale bar, 10 μm.(C) Nomarski images of zebrafish forebrain depicting the location of the mother cells (A-P, anterior posterior; M-L, medial lateral). Colors represent different cell fate lineages as shown in (D).(D) Different clone types observed by time-lapse in vivo imaging.See also Figure S1 and Movie S1.