
|
Fig. S4
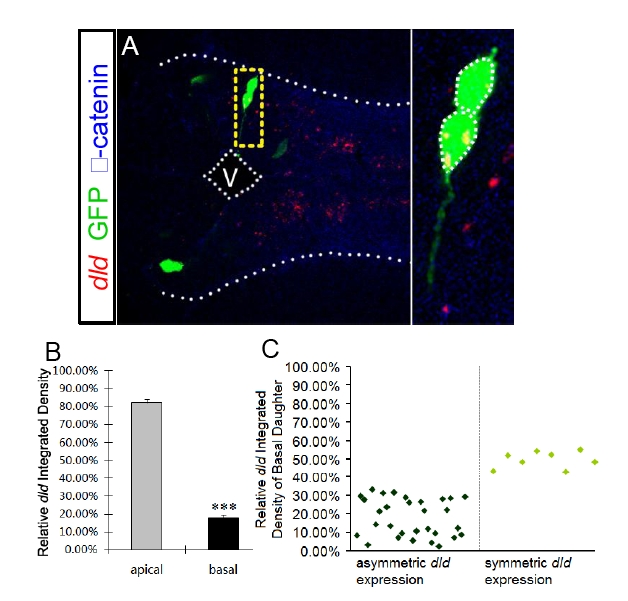
FISH coupled with clonal analyses reveals that the apical daughter cell expresses a higher level of dld, related to Figure 5. (A) FISH of dld (red) coupled with immunohistochemistry of GFP (green) and βcatenin (blue) in forebrain paired daughter cells. The profiles of each daughter cell and the apical and basal surfaces are highlighted by dashed white lines. Enlargement of the yellow-boxed area is shown on the right of each panel. V: ventricle. (B) Quantification the FISH signal of dld in paired daughter cells. *** p < 0.001 vs apical, t-test. (C) Scatter plot shows the relative dld integrated density of the basal daughter cell of each analyzed pair of daughter cells. 30 pairs of daughter cells show asymmetric dld expression, while 8 pairs of daughter cells show symmetric dld expression.