
Image
|
Figure Caption
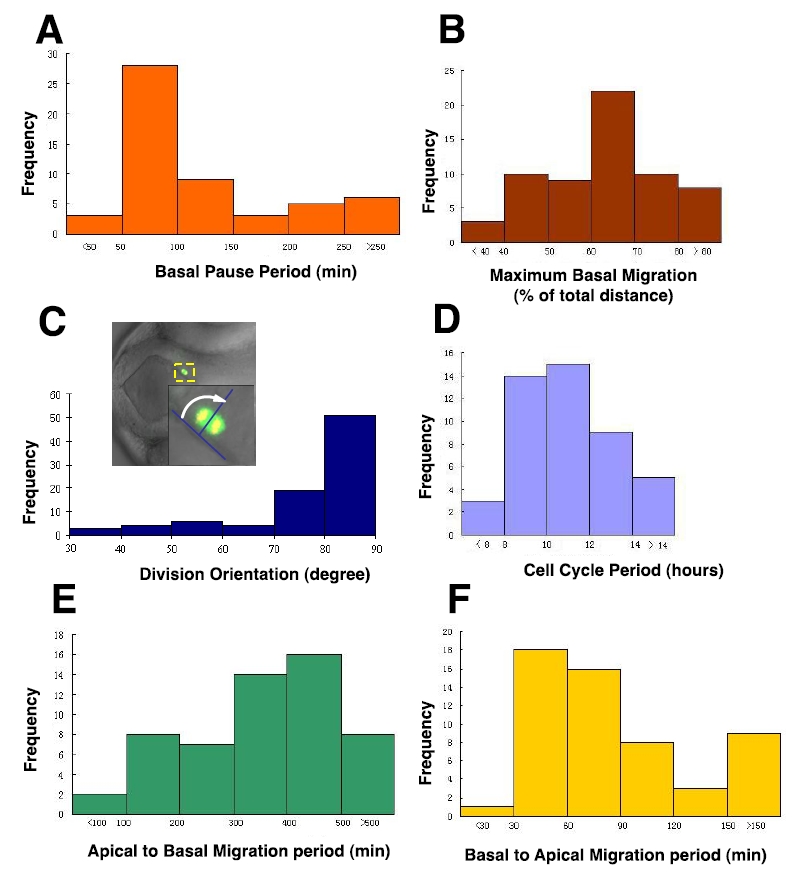
Fig. S2
Heterogeneity of radial glia progenitor cell behavior observed through in vivo time-lapse imaging in the developing zebrafish forebrain from 28 hpf to 60 hpf, related to Figure 2. (A-F) Graphs show the frequency distributions of basal pause period (A), maximum basal migration (B), division orientation (C), cell cycle period (D), apical to basal migration period (E), and basal to apical migration period (F). Please refer to the Experimental Procedures for the measurement of these parameters.
Acknowledgments
This image is the copyrighted work of the attributed author or publisher, and
ZFIN has permission only to display this image to its users.
Additional permissions should be obtained from the applicable author or publisher of the image.
Full text @ Neuron