
Image
|
Figure Caption
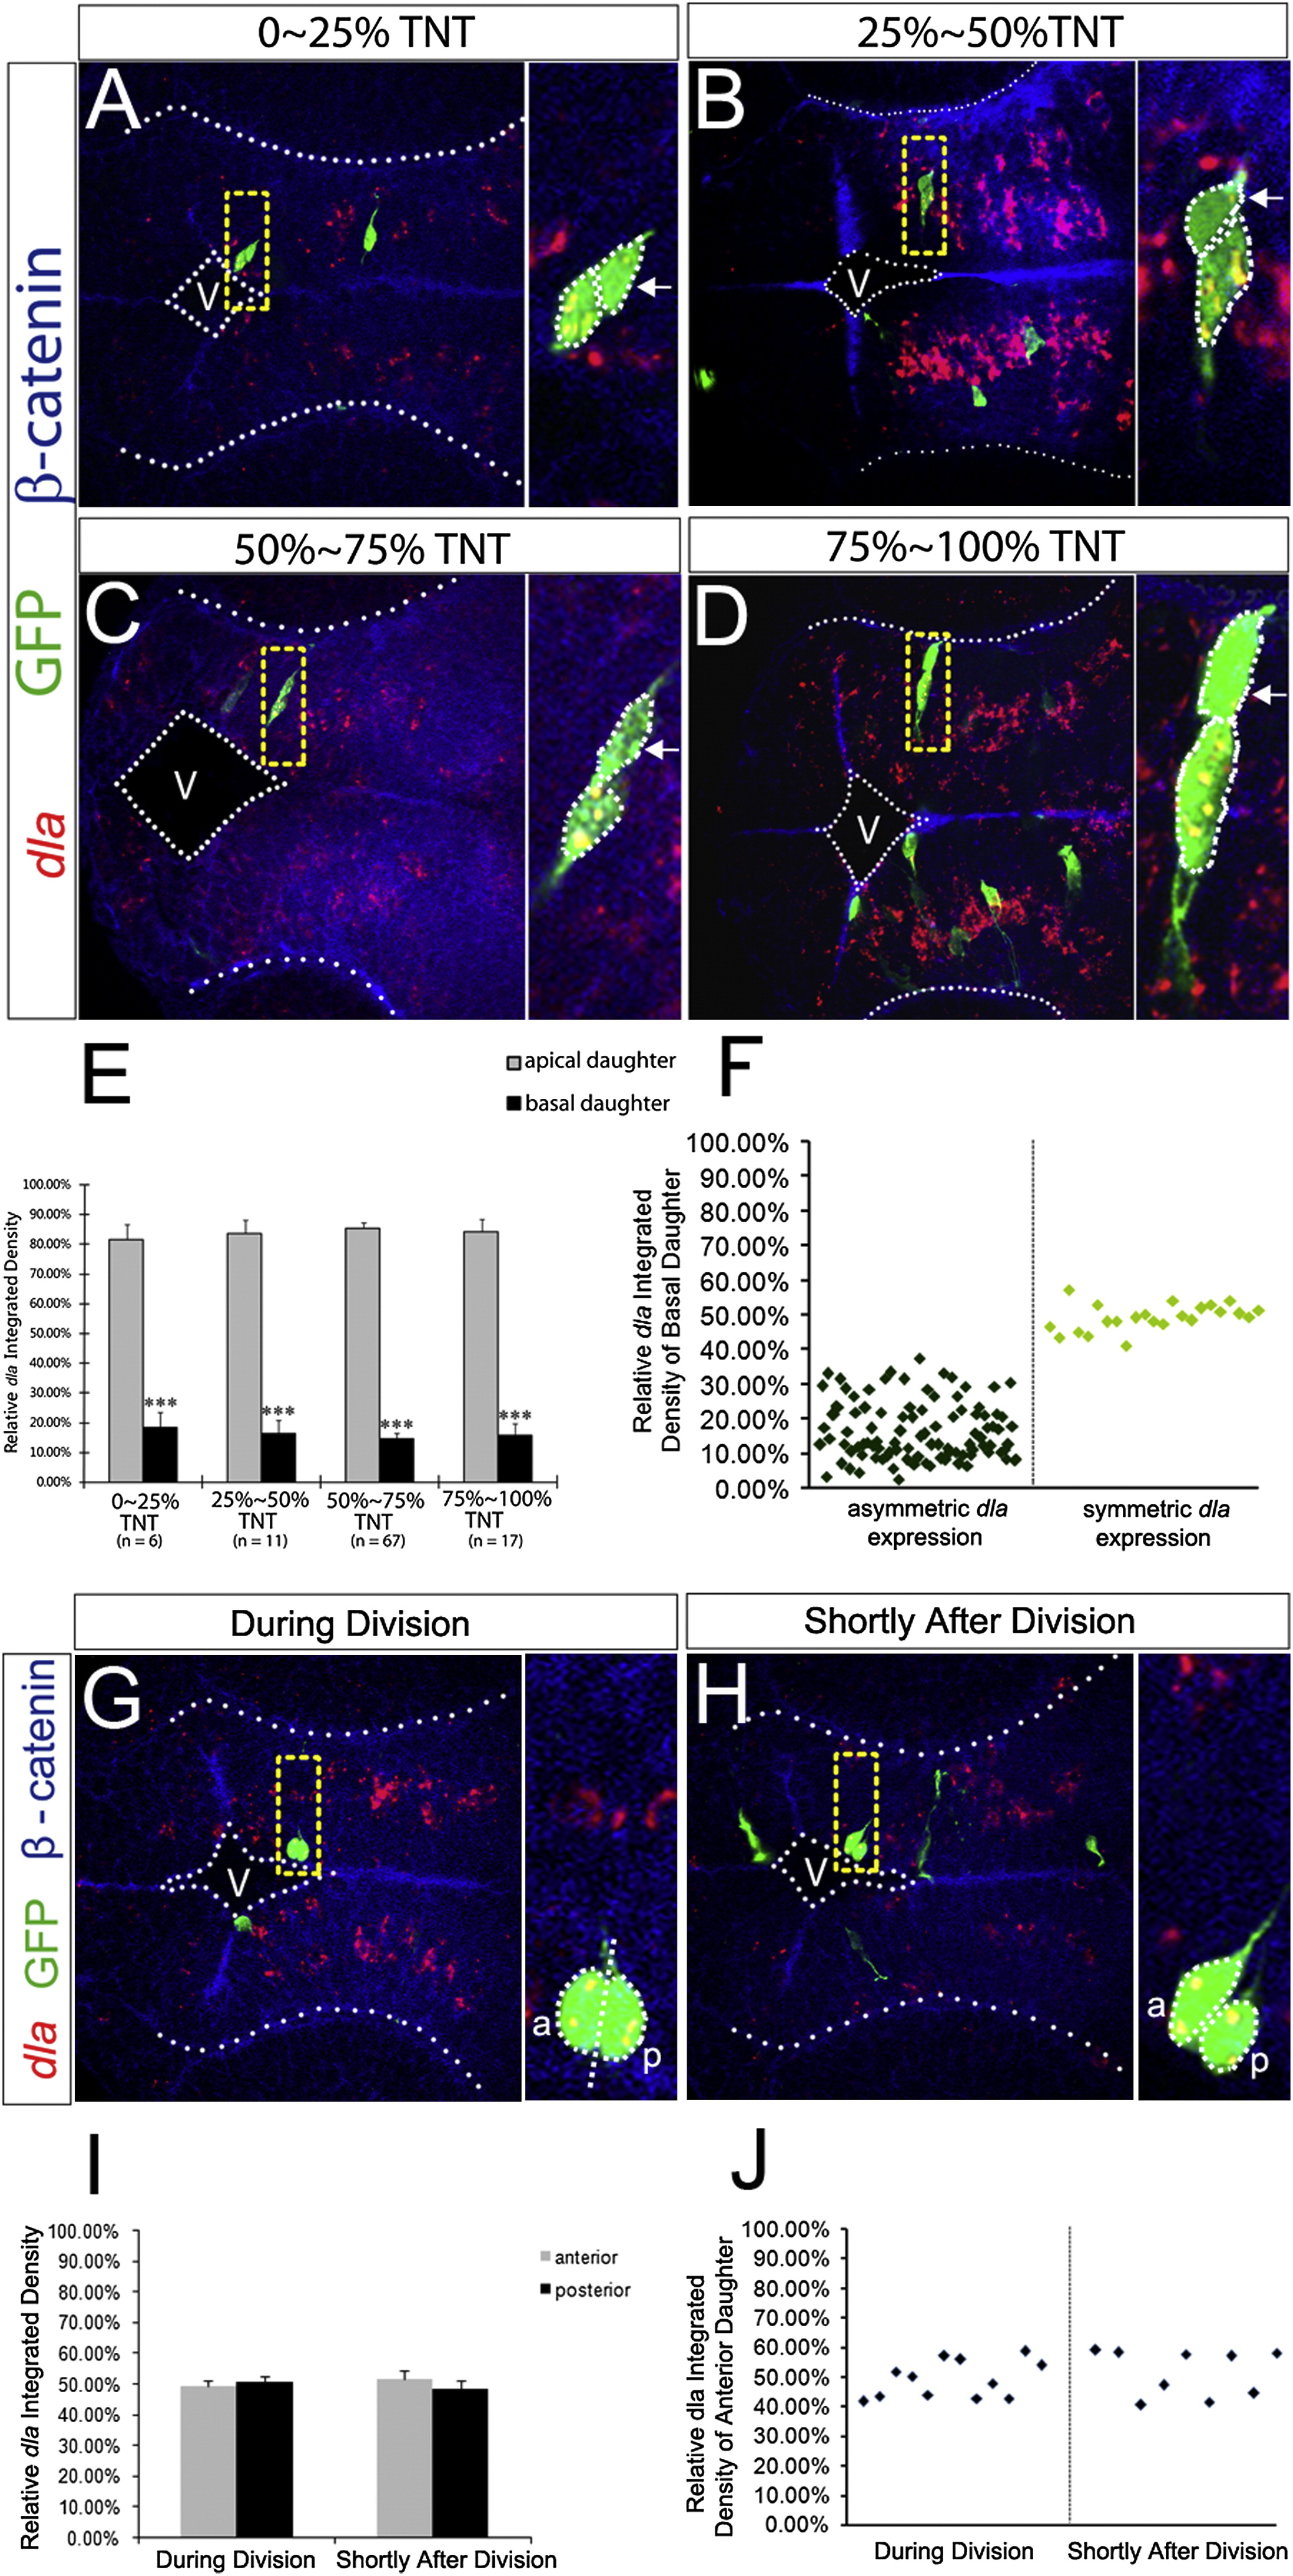
Fig. 5
The Apical Daughter Cell Expresses a Higher Level of dla (A–D) FISH of dla (red) coupled with immunohistochemistry of GFP (green) and β-catenin (blue) in forebrain paired daughter cells. TNT, total neuroepithelium thickness; V, ventricle. (E and F) Quantification for (A)–(D) in bar graph (E) and scatterplot (F). ***p < 0.001 versus apical, t test. (G and H) dla expression during (G) or shortly after division (H). V, ventricle; a, anterior; p, posterior. (I and J) Quantification for (G) and (H) in bar graph (I) and scatterplot (J). Error bars in (E) and (I) represent SEM. See also Figure S4.
Acknowledgments
This image is the copyrighted work of the attributed author or publisher, and
ZFIN has permission only to display this image to its users.
Additional permissions should be obtained from the applicable author or publisher of the image.
Full text @ Neuron