
|
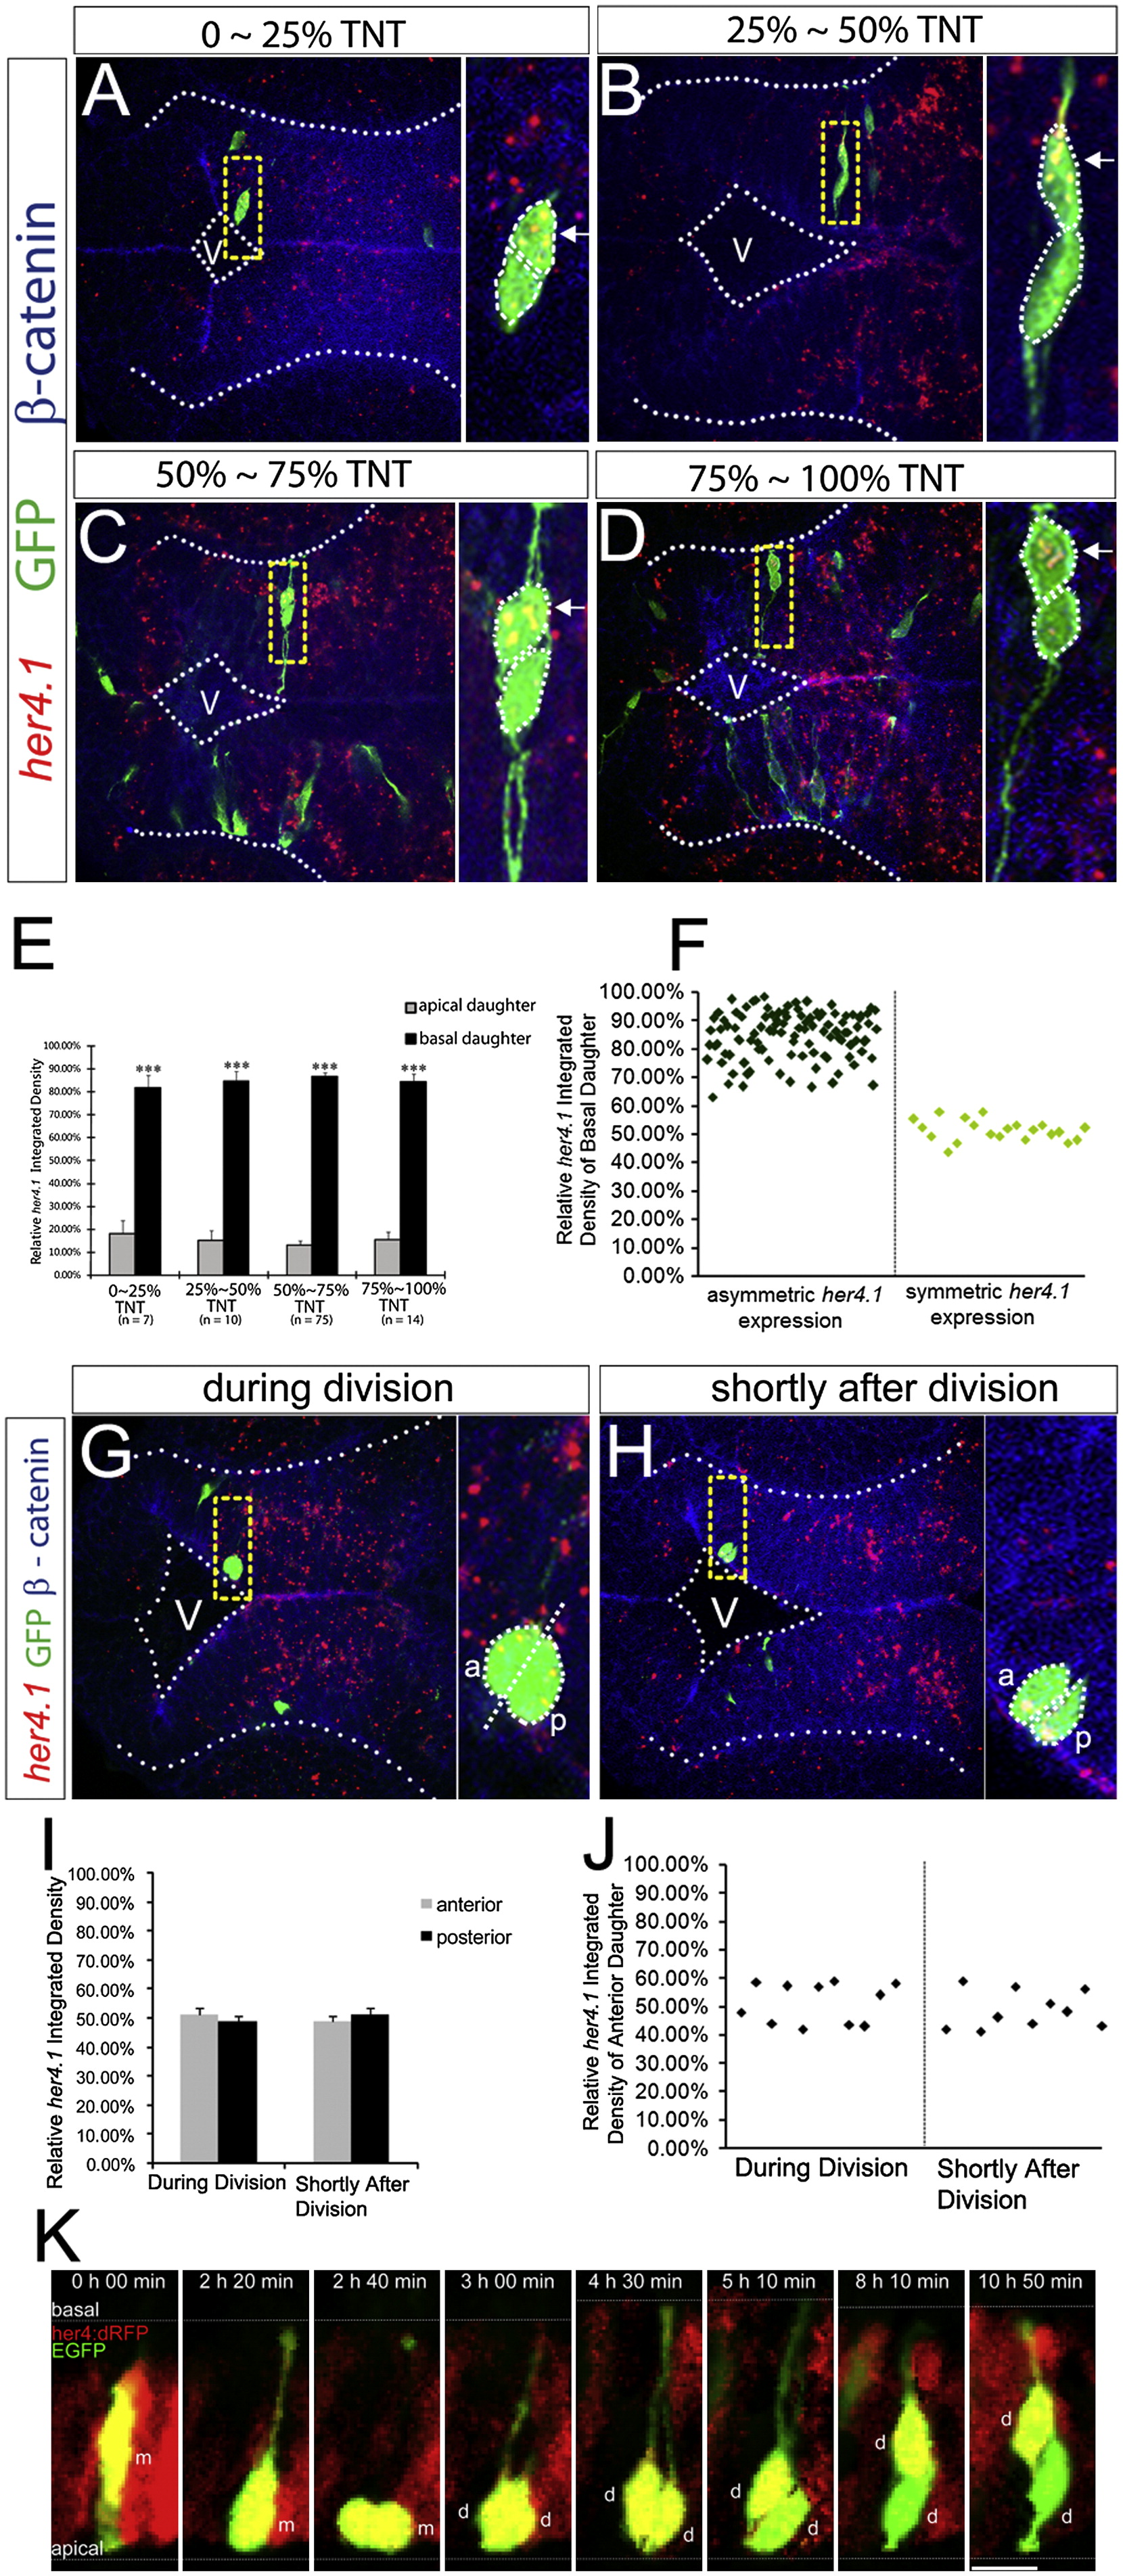
Fig. 4
The Basal Daughter Cell Expresses a Higher Level of her4.1(A–D) FISH of her4.1 (red) coupled with immunohistochemistry of GFP (green) and β-catenin (blue) in forebrain paired daughter cells. Images are assembled according to the distance of the basal daughter cell to the ventricular surface. TNT, total neuroepithelium thickness. Enlargement of the yellow-boxed area is shown on the right of each panel. V, ventricle.(E and F) Quantification of the FISH signal of her4.1 in paired daughter cells shown in a bar graph (E) or scatterplot (F). ***p < 0.001 versus apical, t test.(G and H) her4.1 expression in forebrain progenitor cells during division (G) or shortly after division (H). V, ventricle; a, anterior; p, posterior.(I and J) Quantification for (G) and (H) in bar graph (I) or scatterplot (J).(K) Representative montage of selected images from time-lapse in vivo imaging of a single EGFP-labeled mother cell in the hindbrain of her4:dRFP transgenic embryo. m, mother cell; d, daughter cells. Scale bar, 10 μm. Error bars in (E) and (I) represent SEM.See also Figure S3 and Movie S2.