
|
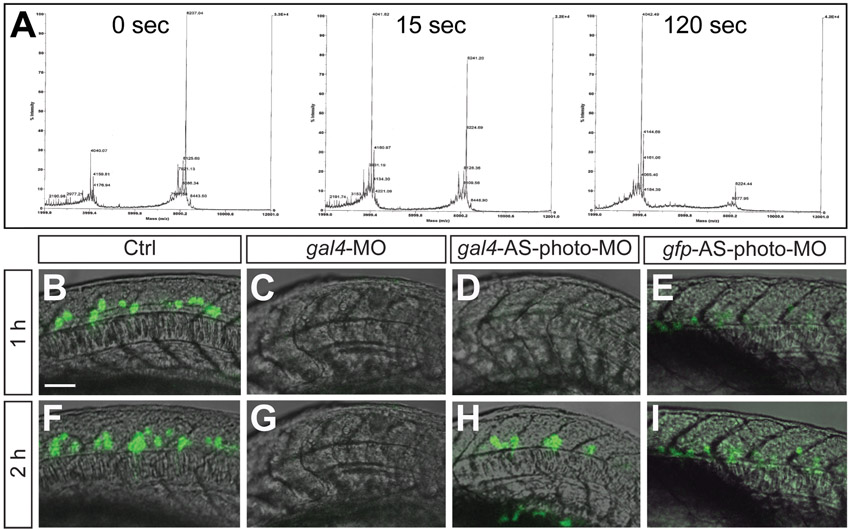
Fig. S2
Time course showing cleavage of the photo-element and in vivo time line. (A) Examples of mass spectroscopy reads obtained after in vitro UV exposure of gfp-AS-photo-MO at 0, 15 and 120 seconds, showing complete cleavage of the photo-element after 2 minutes. (B-I) In vivo time course showing onset of fluorescent protein expression in Tg(mnx1:Gal4-VP16,UAS:GFP) embryo exposed to 5 minutes UV using gal4-MO (C,G), gal4-AS-photo-MO (D,H) and gfp-AS-photo-MO (E,I). (C,D) No fluorescent signal in gal4-MO (C) and gal4-AS-photo-MO (D) injected embryos but signal in gfp-AS-photo-MO injected embryos (E) 1 hour after UV exposure. (H) Fluorescent signal in gal4-AS-photo-MO injected embryos 2 hours after UV exposure. Scale bar: 50 μm.