
|
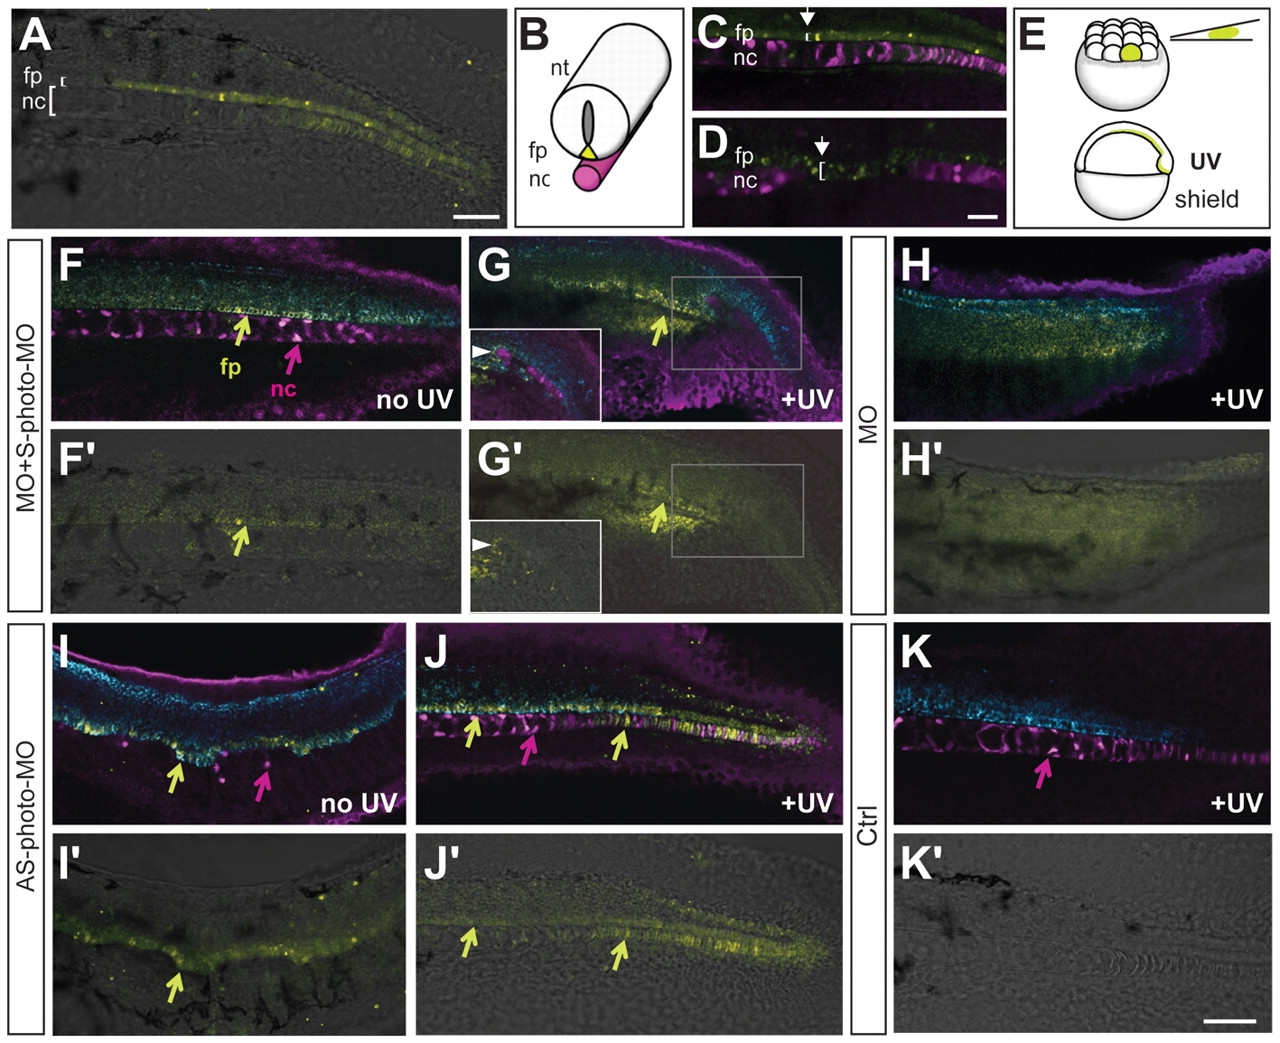
Fig. 2
Spatially restricted control of gene function using S- or AS-photo-MOs confirms ntla-dependent cell fate choice of MPCs. (A) Lateral view of live 28 hpf embryo highlighting notochord (nc) and floor plate (fp), created by a mosaic distribution of fluorescein-labeled control MO (yellow). (B) Cartoon showing neural tube (nt), fp (yellow) and underlying nc (magenta). (C,D) Distribution of fp cells (fluorescein, yellow) and Ntla antibody labeling in the notochord (magenta) in wild-type embryo (C) and ntla-MO-injected embryo lacking Ntla in some cells (arrow in D), leading to excess fp at the expense of notochord (compare extent of brackets). (E) Mosaic distribution of MO in non-neural tissues by injecting into one marginal cell of a 16-cell embryo. Embryos were exposed to UV at shield stage. (F-J2) Embryos show fluorescence (MO-fluorescein, yellow) in fp and/or notochord, Ntla (magenta) in notochord and zrf1 (cyan) staining in fp and neural tube. (G,G2) Inset in the bottom left corner shows a different z plane of the region marked by a gray box. Arrowheads point to the same Ntla-positive cell. (K,K2) Uninjected control embryo showing normal Ntla (magenta) and zrf1 (cyan) staining. (F-K2) Images show bright field and fluorescence labeling at 26-28 hpf. Embryos were injected with MO or photo-MOs as indicated and subjected to UV exposure as indicated (no UV, +UV). Scale bars: 30 μm for C,D; 50 μm for A,F-K2.