
|
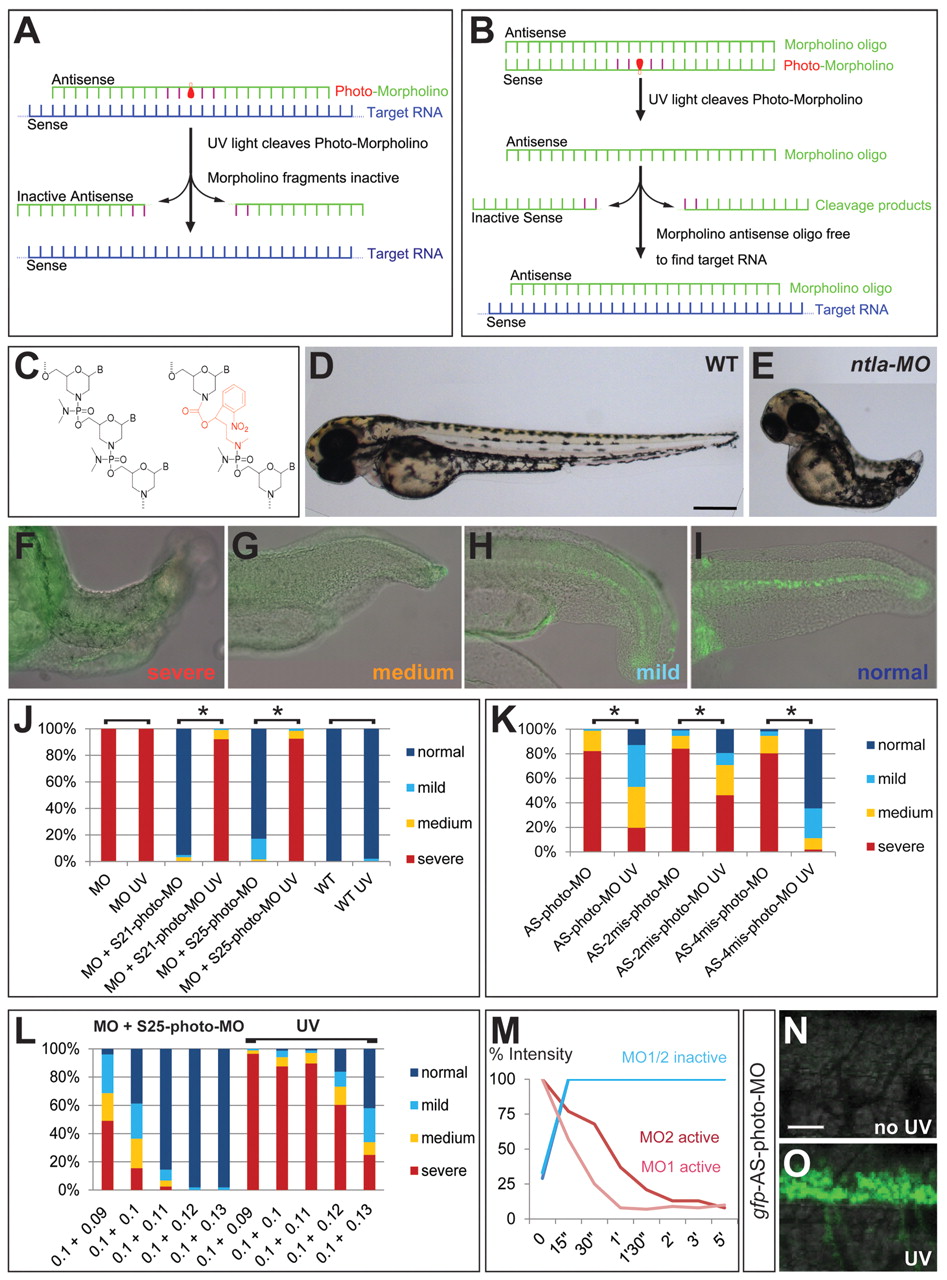
Fig. 1
S-photo-MO and AS-photo-MO regulate Ntla function. (A,B) Diagrams describing the mechanism of AS-photo-MO (A) and S-photo-MOs (B). (C) Molecular structure of the photo-subunit (red) and its position within the MO (green). (D,E) Lateral view of a wild-type embryo (D) and an ntla-MO injected embryo, missing posterior trunk and tail (E) at 48 hpf. Scale bar: 250 μm. (F-I) Overlays showing bright field and anti-Ntla labeling (green) in injected embryos at 26-28 hpf. Examples of severe (F), medium (G), mild (H) and normal (I) phenotypes. (J-L) Graphs showing percentage of embryos injected with MOs and photo-MOs resulting in severe (red), medium (orange), mild (light blue) and normal (dark blue) phenotypes, based on morphology. (J) ntla-S-photo-MOs of a length of 21 nucleotides (S21-photo-MO) and/or 25 nucleotides with four mismatches (S25-photo-MO) allow or block protein formation dependent on UV exposure. MO, n=60; MO UV, n=179; MO+S21-photo-MO, n=58; MO+S21-photo-MO UV, n=125; MO+S25-photo-MO, n=61; MO+S25-photo-MO UV, n=116; WT, n=114; WT UV, n=135. (K) All ntla-AS-photo-MO tested sufficiently block ntla gene function. Introducing two mismatches on either side of the photo-subunit (AS-4mis-photo-MO) significantly improved dissociation rate from the target and therefore recovery (P<0.05) of the phenotype after photo-cleavage compared with AS-photo-MO. AS-photo-MO, n=84; AS=photo=MO UV, n=132; AS-2mis-photo-MO, n=113; AS-2mis-photo-MO UV, n=134; AS-4mis-photo-MO, n=112; AS-4mis-photo-MO UV, n=152. Asterisks indicate significant differences (P<0.05) between untreated and UV-treated embryos. Student’s t-test includes data in groups ‘severe’ and ‘normal’. (L) Distribution of phenotypes after injecting different ratios of ntla-MO to S25-photo-MO solutions. The horizontal bar marks samples exposed to UV. (M) Quantification of in vitro mass spectroscopy analyses showing percentage of intensity of active (intact photo-element, red, pink) and inactive (cleaved photo-element, blue) ntla- or gfp-AS-photo-MOs, MO1 and MO2 respectively, measured over time after UV exposure. (N,O) Embryos injected with gfp-AS-photo-MO without UV exposure (N) and with UV exposure (O). Scale bar: 30 μm.