
|
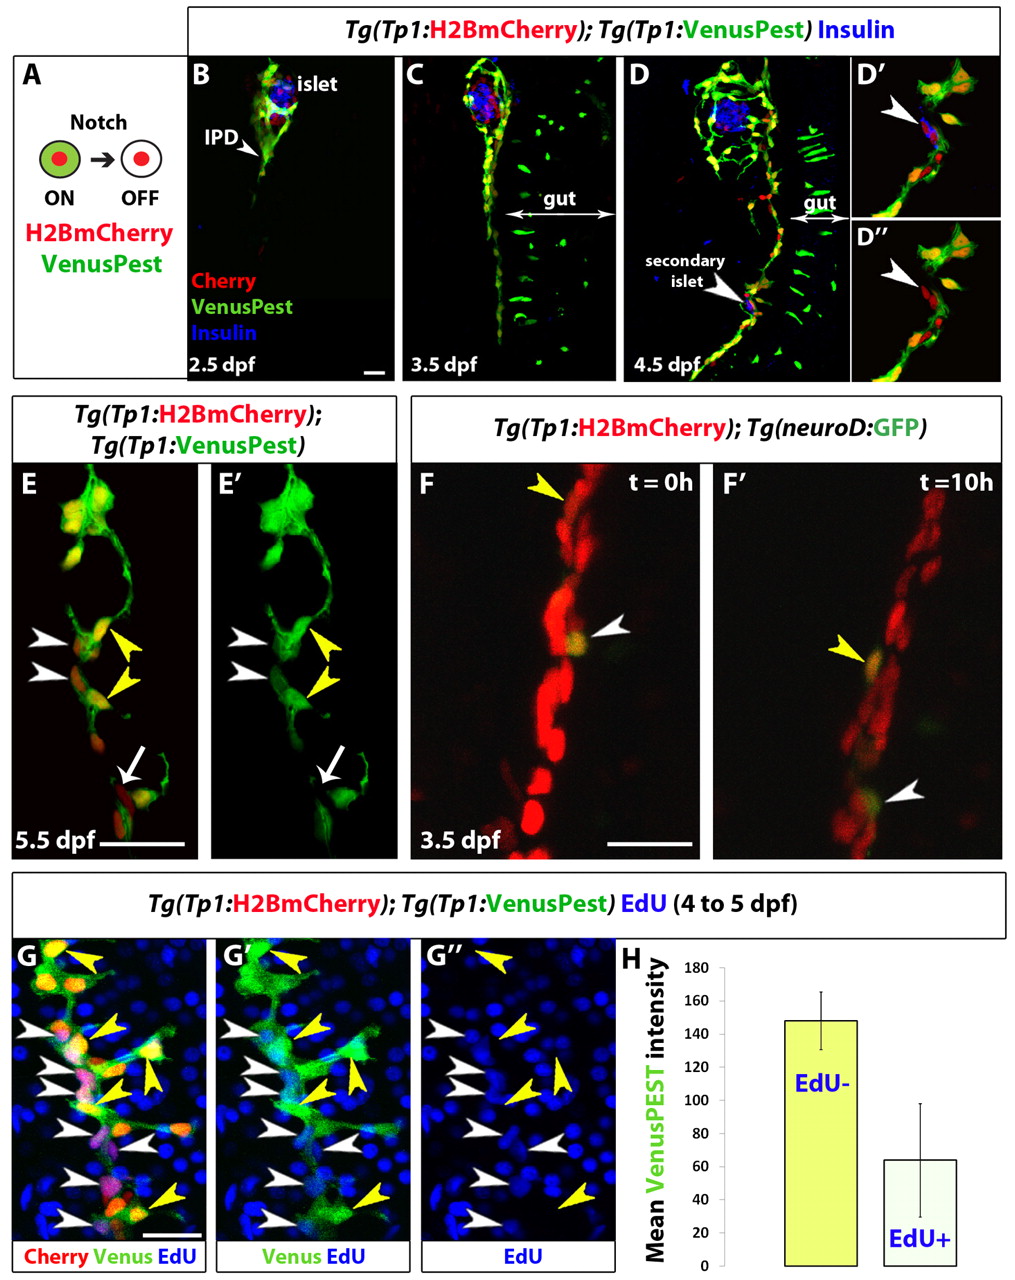
Fig. 1
Distinct levels of Notch signaling determine differentiated or quiescent states of NRCs. (A) Tg(Tp1:H2BmCherry) drives expression of H2BmCherry, which has a very long half-life, in NRCs. Tg(Tp1:VenusPest) drives expression of a destabilized VenusPEST fluorescent protein, which has a short half-life, in NRCs. Cells with active Notch signaling are Tg(Tp1:H2BmCherry)+ and Tg(Tp1:VenusPest)+. Cells that had active Notch signaling but lost Notch signaling are Tg(Tp1:H2BmCherry)+ but Tg(Tp1:VenusPest)- (supplementary material Fig. S1A-C, Fig. S2). (B-D3) Tg(Tp1:H2BmCherry); Tg(Tp1:VenusPest) larvae were fixed at progressive developmental stages and stained for Insulin to visualize β-cells. NRCs undergo cell shape changes, migration and proliferation to build the IPD. (D-D′′) At 4.5 dpf, a pair of β-cells (white arrowhead) have formed a secondary islet along the IPD. To better visualize these cells, a high magnification single plane is shown in D2,D3 with separate channels. The two β-cells (arrowheads) are Tg(Tp1:H2BmCherry)+ but Tg(Tp1:VenusPest)-, indicating that they originated from NRCs that turned off Notch signaling. (E,E′) Tg(Tp1:H2BmCherry); Tg(Tp1:VenusPest) larvae were fixed and examined at 5.5 dpf. A single plane through the IPD is shown. Based on the fluorescence intensity of Tg(Tp1:VenusPest) expression, NRCs are Tg(Tp1:VenusPest)hi (yellow arrowheads), Tg(Tp1:VenusPest)low (white arrowheads) or Tg(Tp1:VenusPest)- (arrow), indicating that they experience different levels of Notch signaling. (F,F′) Live imaging of Tg(Tp1:H2BmCherry); Tg(neurod:EGFP) larva at 3.5 dpf. Tg(Tp1:H2BmCherry) expression labels NRCs (red) and Tg(neurod:EGFP) expression labels endocrine cells and their direct progenitors (green). White arrowheads indicate a differentiating endocrine cell. Yellow arrowheads indicate a single NRC that, over time, upregulates Tg(neurod:EGFP) expression, suggesting onset of endocrine lineage differentiation. The cells shift position over time owing to the morphogenesis of the pancreas. (G-G3) Tg(TP1:H2BmCherry); Tg(TP1:VenusPEST) larvae were incubated with EdU from 4 to 5 dpf for cell cycle analysis. Yellow arrowheads indicate Tg(TP1:VenusPEST)hi NRCs; the majority are EdU-, whereas neighboring NRCs with lower levels of Tg(TP1:VenusPEST) expression are EdU+ (white arrowheads). (H) Mean Tg(TP1:VenusPEST) fluorescence intensity was calculated for 163 EdU- and 109 EdU+ NRCs (from confocal stacks of four larvae). The average mean fluorescence intensity value (±s.d.) between larvae for EdU- NRCs was 148 (s.d.=17.4) and for EdU+ NRCs was 63.9 (s.d.=34.2) (P<0.01). All images are lateral views, anterior towards the top, ventral towards the right. The NRCs ventral to the IPD in C, D and F are gut cells. Scale bars: 20 μm.