
|
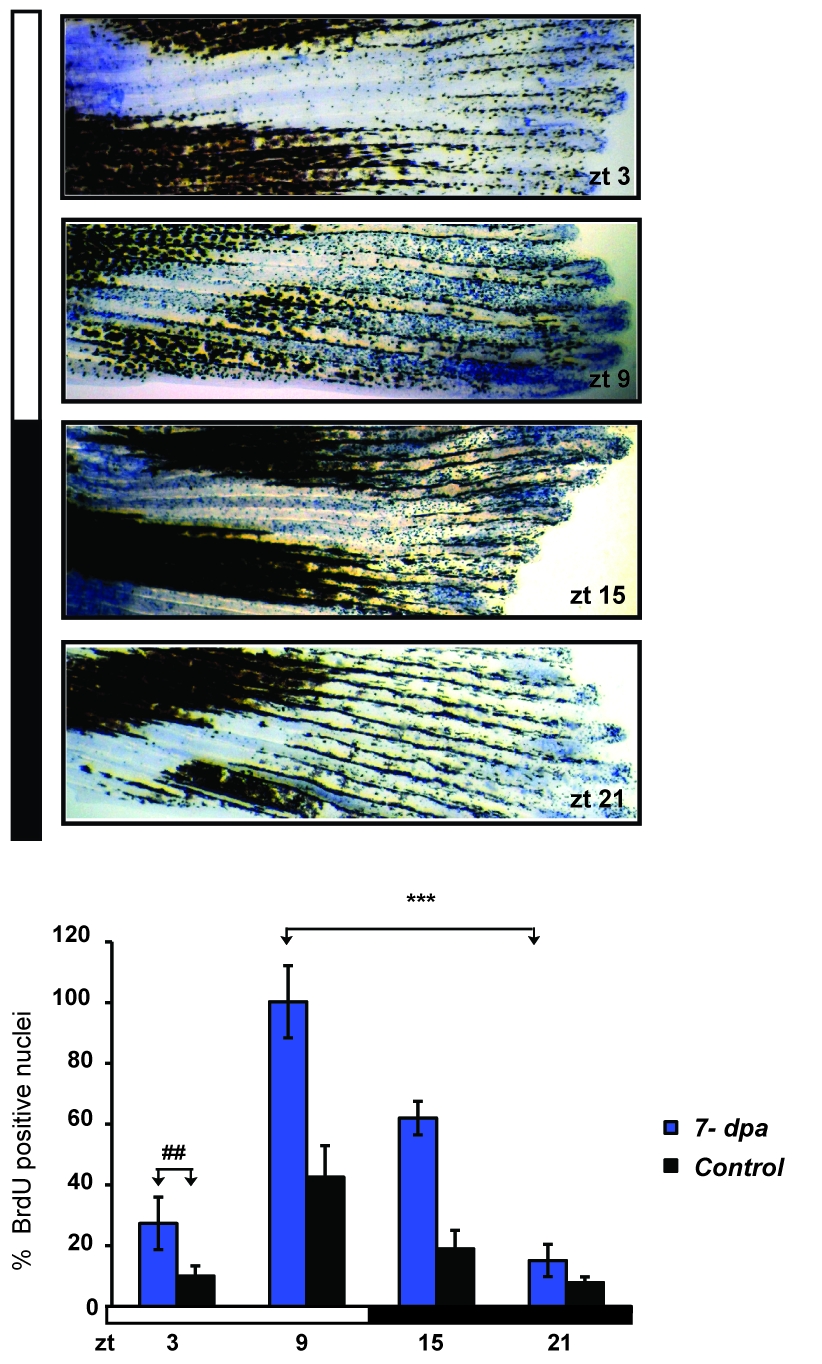
Fig. S4
High amplitude circadian epithelial cell cycle rhythms persist during fin re-growth. Representative fin segments stained for BrdU incorporation at four zeitgeber times (ZT) distributed through one 24 hours cycle, starting 7 days post amputation (7 dpa). Below, quantification of the level of BrdU staining in fins amputated 7 days previously (blue bars) compared with non-amputated control fins (black bars). On the Y-axis is plotted the % of BrdU positive nuclei with respect to the largest value (ZT 9, 7 dpa). Each time point represents the mean value +/- SEM calculated for a total of n = 6 fins. The result of statistical analysis of the peak and trough values for the amputated fins is indicated by asterisks (Bonferroni′s post hoc test p<0.0001) and horizontal “brackets” above the graph. Furthermore, statistically significant differences observed at each time point between the amputated and non-amputated fins are indicated for simplicity, by the symbol “#” and a bracket above only the first time point (ZT3) (Bonferroni′s post hoc test p<0.001). White and black bars denote the light and dark periods respectively. The data were subjected to Cosinor analysis to test for the absence or presence of 24-h rhythmicity (see Table S1, Figure S2).