
|
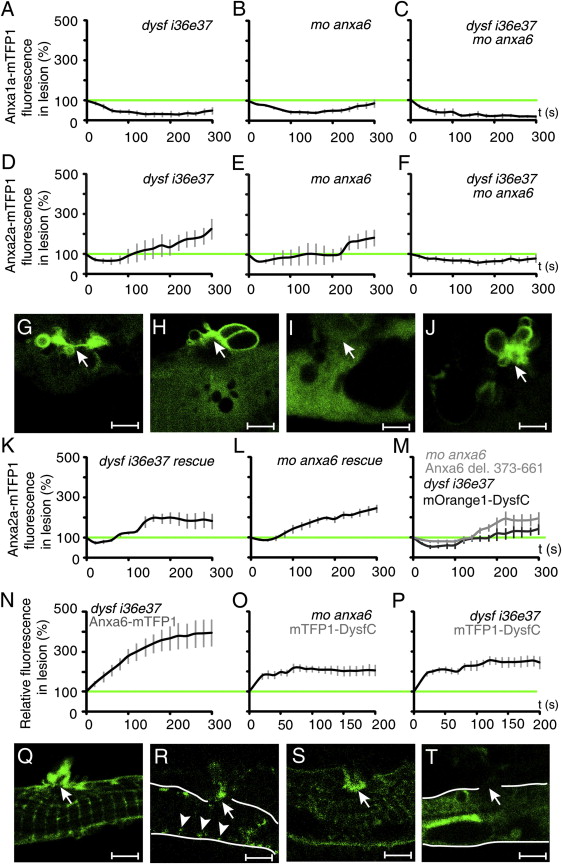
Fig. 7
Functional Interactions in Repair Patch Formation
(A–I) Anxa1a accumulation is impaired in dysf i36e37 morphants (A), anxa6 morphants (B) and dysf/anxa6 double morphants (C). Anxa2a-mTFP1 accumulation is delayed in dysf i36e37 morphants (D), severely perturbed in anxa6 morphants (E) and impaired in dysf/anxa6 double morphants (F). The repair patch (arrow) morphology at the 3 min time point after damage (as illustrated by Anxa2a-mTFP1) is severely affected in dysf i36e37 morphants (G) and in anxa6 morphants (H). Anxa2a diffuses out of the cell at the 3 min time point after membrane rupture (arrow) without aggregating into a patch in double morphants (I).
(J) In a few cases, larger vesicles were visible in the double morphants.
(K) Full-length Dysf-mOrange1 rescues Anxa2a-mTFP1 recruitment in dysf i36e37 morphants.
(L) Anxa6-mOrange1 rescues Anxa2a-mTFP1 accumulation in anxa6 morphants.
(M) Expression of mOrange1-DysfC or Anxa6 del-mOrange1 (lacking 4 C-terminal Ca2+-sensitive domains) do not rescue Anxa2a-mTFP1 patch formation in dysf i36e37 or anxa6 morphants, respectively.
(N) Anxa6-mTFP1 rapid response is not perturbed in dysf i36e37 morphants.
(O) mTFP1-DysfC response to membrane damage is not affected in anxa6 morphants.
(P) Unperturbed mTFP1-DysfC accumulation at the site of sarcolemmal lesion in dysf i36e37 morphants.
(Q) mTFP1-DysfC accumulation at the sarcolemmal rupture (arrow) in anxa6 morphants at 60 s after damage.
(R) Full-length Dysf-mTFP1 is maintained at the T-tubule neck regions (arrowhead) and accumulates at the site of sarcolemmal lesion (arrow) in anxa6 morphants (3 min after damage).
(S) mTFP1-DysfC accumulation at the site of sarcolemmal lesion (arrow) in dysf i36e37 morphants at 3 min after damage.
(T) mTFP1-Rab27a does not respond to membrane damage (arrow) in dysf i36e37 morphants (3 min after damage). In all the charts (A–F, K–P), the change at the site of lesion is indicated as percentage relative to the undamaged state (green line; mean from 6–10 experiments). Cell is outlined in white in (R) and (T). Arrow in (G–J) and (Q–T) indicates site of damage.Scale bars represent 4 μm. See also Figure S5.
Reprinted from Developmental Cell, 22(3), Roostalu, U., and Strähle, U., In Vivo imaging of molecular interactions at damaged sarcolemma, 515-529, Copyright (2012) with permission from Elsevier. Full text @ Dev. Cell