
Fig. S2
- ID
- ZDB-IMAGE-120329-14
- Publication
- Dempsey et al., 2012 - PhOTO Zebrafish: A Transgenic Resource for In Vivo Lineage Tracing during Development and Regeneration
- All Figures
- Figures for Dempsey et al., 2012
|
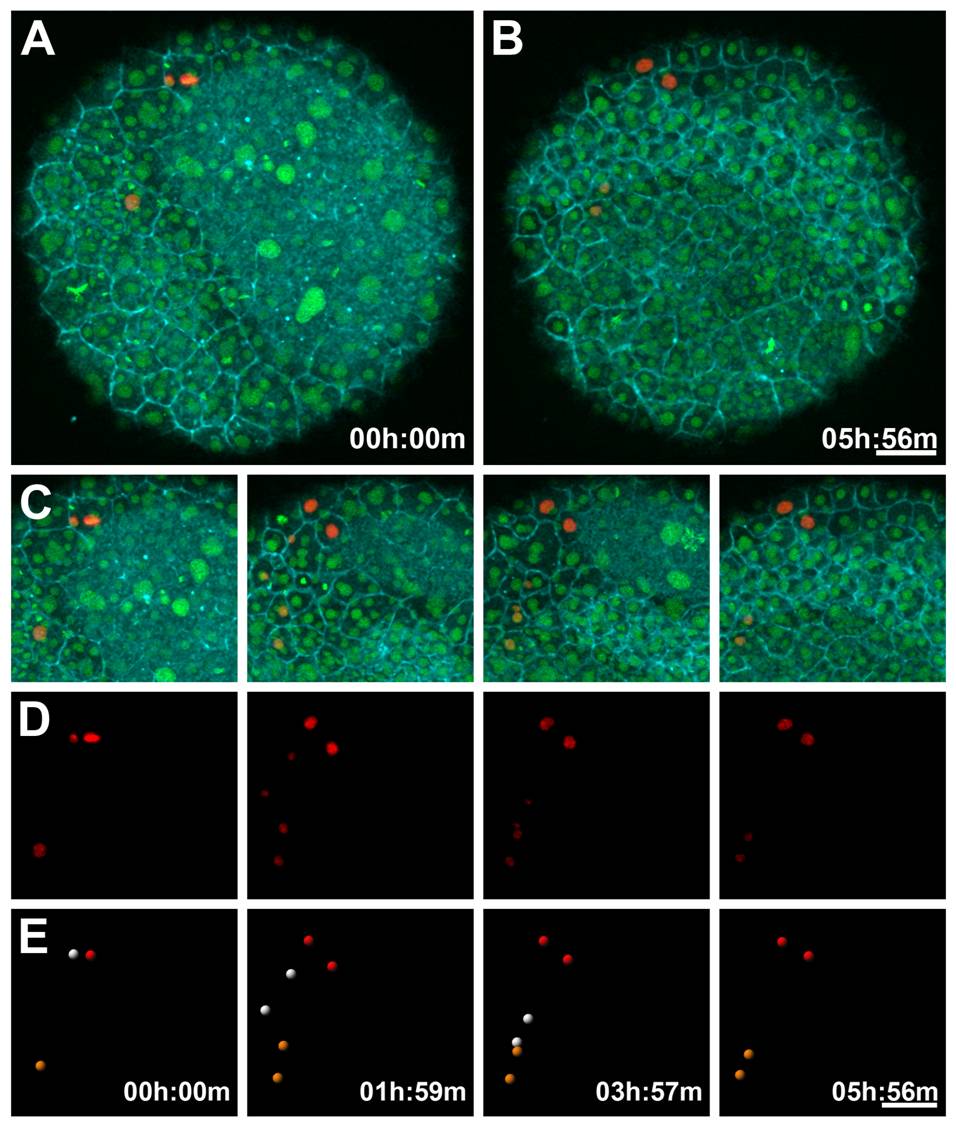
Fig. S2 Nuclear Photoconversion and Segmentation in a PhOTO-N Zebrafish During Gastrulation. Animal pole view maximum intensity projection (MIP) images of the first 10.5μm (in depth from the animal pole) of an ~6 hour time-lapse of a heterozygote F1 PhOTO-N zebrafish from late gastrulation (>80% epiboly) until early segmentation. (A) Merged MIP of the first frame of the time-lapse, showing memb-Cerulean (blue) and both unconverted (green) and segmented photoconverted (red) H2B-Dendra2. (B) Merged MIP image of the final time frame of the time-lapse. (C) Zoomed in MIP areas at four different time-points of the merged fluorescence images as a reference for the photoconverted images seen in panels (D) and (E). (D) Intensity images from segmented photoconverted nuclei (red) for the same 4 timepoints as the merged image in panel (C). (E) Segmented nuclei from the intensity images from panel (D). Two enveloping layer (EVL) cells are photoconverted (the orange and red spheres) as well as an epiblast cell (the white sphere). Each cell undergoes a single cell division during the course of the time-lapse. Note that the epiblast cells move beneath the field of view in the last frame, due to the development of the head during early segmentation. Scale bars are 50μm.