
Fig. 2
- ID
- ZDB-IMAGE-120329-10
- Publication
- Dempsey et al., 2012 - PhOTO Zebrafish: A Transgenic Resource for In Vivo Lineage Tracing during Development and Regeneration
- All Figures
- Figures for Dempsey et al., 2012
|
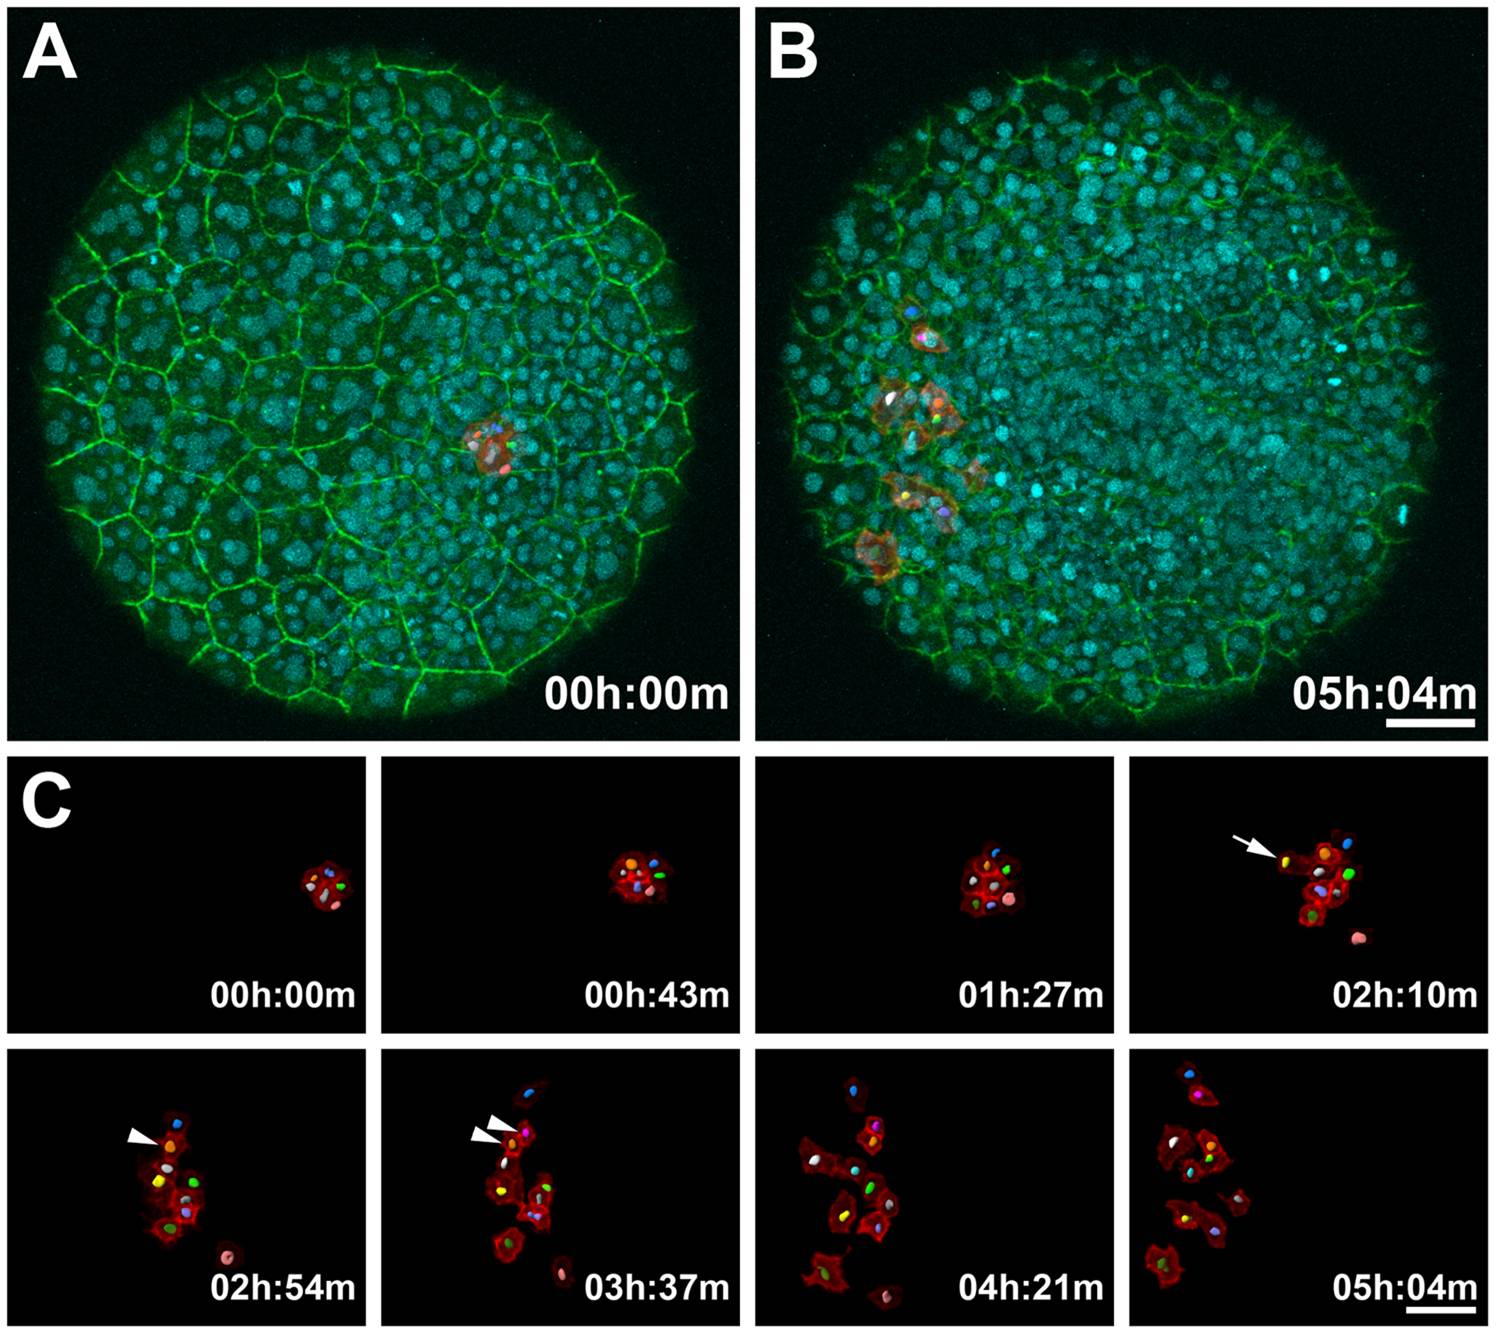
Fig. 2 Monitoring Dynamic Membrane Movements and Tracking Nuclei in a PhOTO-M Zebrafish During Gastrulation.
Animal pole view maximum intensity projection (MIP) images of the first 21µm (in depth) of an ~5 hour time-lapse of a heterozygote F1 PhOTO-M zebrafish from late gastrulation (>80% epiboly) until early segmentation. (A) Merged MIP of the first frame of the time-lapse, showing unconverted (green) memb-Dendra2, segmented photoconverted (red) memb-Dendra2, and H2B-Cerulean (blue) labeled nuclei as well as segmented H2B-Cerulean nuclei (multi-colored surfaces in the photoconverted cells). (B) Merged MIP image of the final frame of the time-lapse. (C) Zoomed MIP images of segmented, photoconverted, and migrating memb-Dendra2 intensity data (red) and segmented H2B-Cerulean nuclei (multi-colored surfaces) at 8 different time-points. Note that H2B-Cerulean was segmented using the surrounding membranes as a guide in three dimensions. Cells are migrating in front of the developing head and move apart laterally. Arrowheads depict a cell division event and the arrow depicts a cell moving into the field of view from below. Note that a few overlying enveloping layer (EVL) cells were photoconverted in addition to the tracked cells, but since these remained stationary throughout the time-lapse, they were neglected when performing semi-automated membrane segmentation of the data. Scale bars are 50μm.