
|
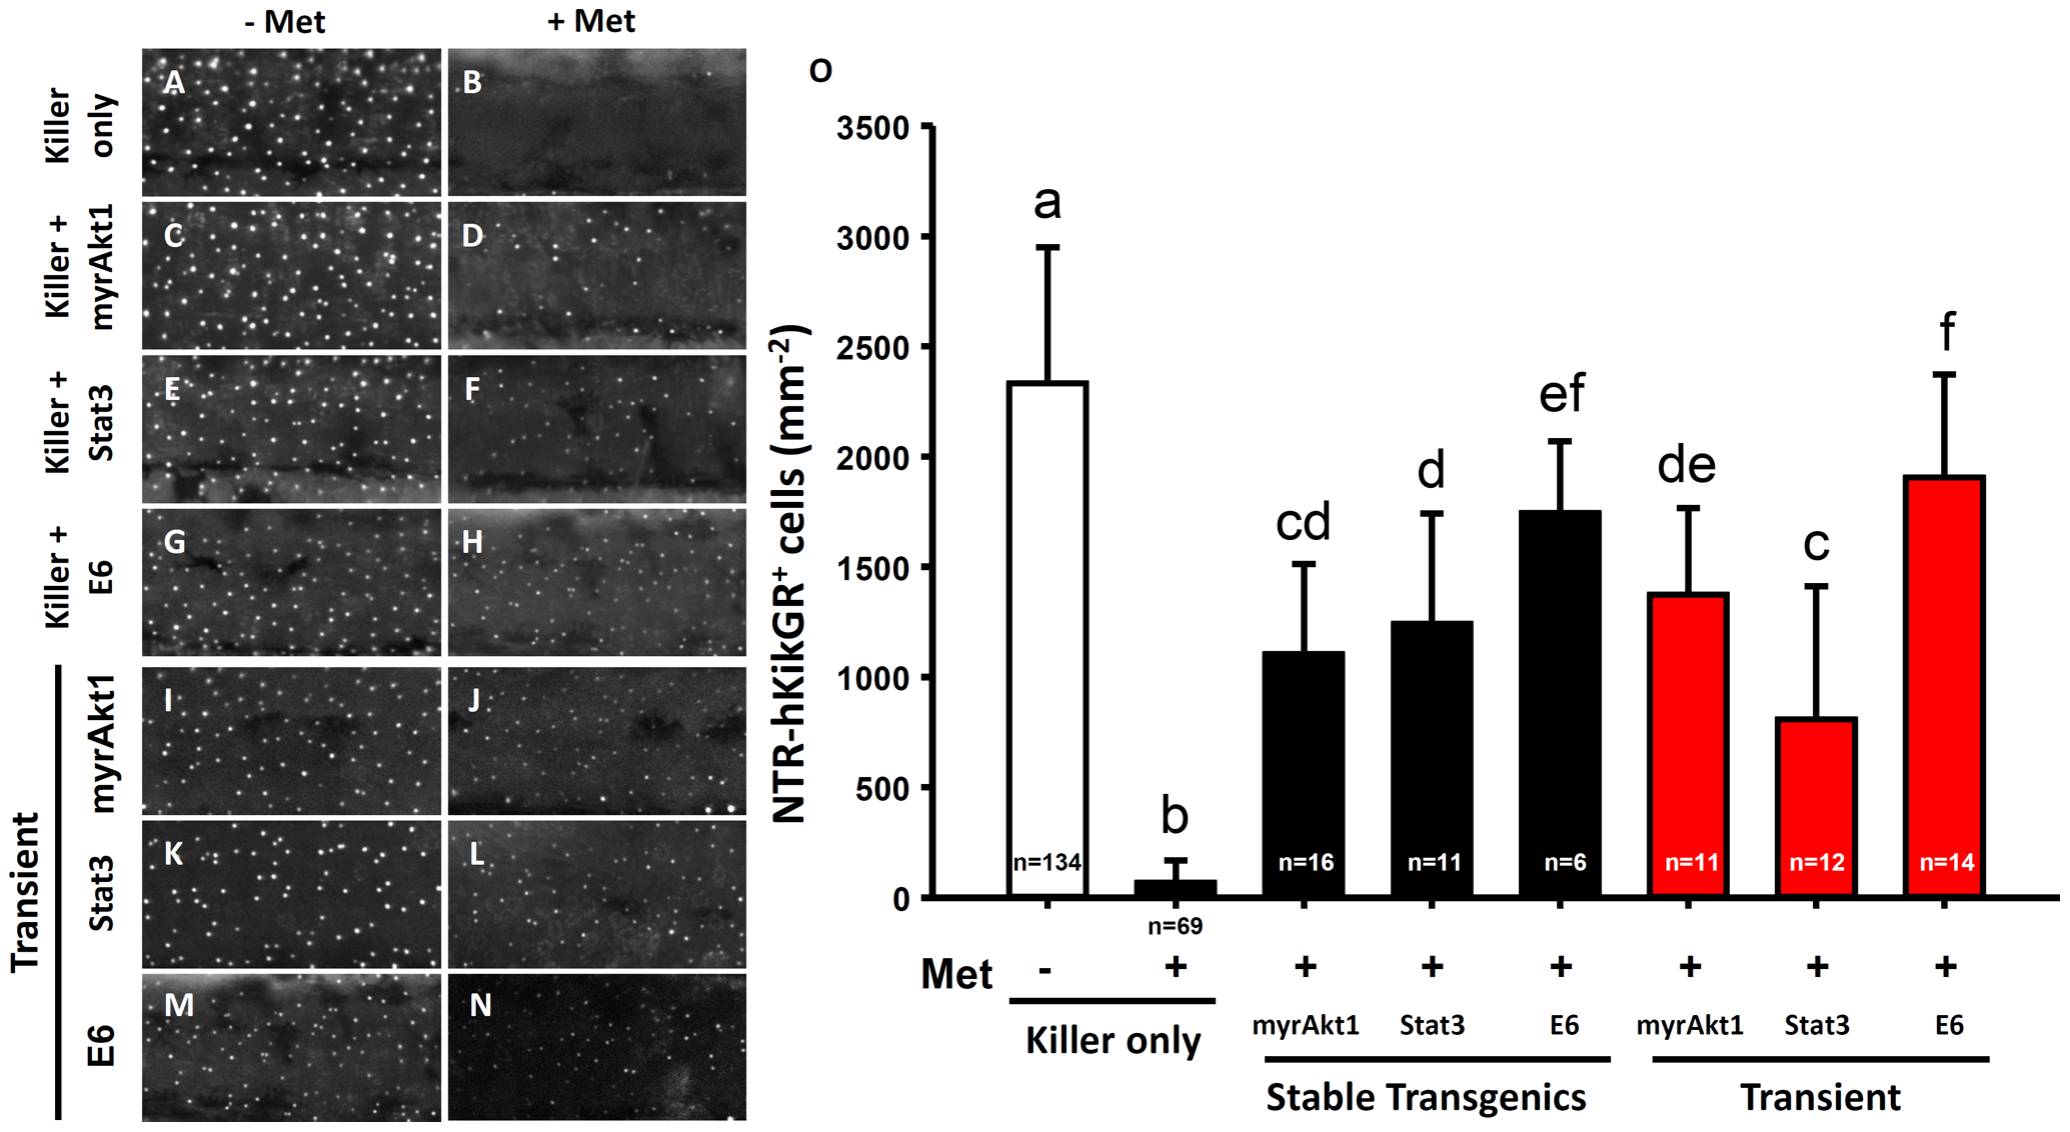
Fig. 8 Functional validation of potential apoptosis modulators in the living killer line embryos by crossing transgenic lines or transient plasmid DNA injection.
(A–H) The NTR-hKikGR+ fluorescent signals in embryos derived from crossing of killer line with testing line carrying human constitutively active Akt1 (myrAkt1) (C, D), mouse constitutively active Stat3 (Stat3) (E, F), or HPV16 E6 (E6) transgenes (G, H). (I–N) NTR-hKikGR+ fluorescent signals in killer line embryos after injection with plasmids carrying myrAkt1 (I, J), Stat3 (K, L), or E6 transgenes (M, N). (O) Statistical comparison of the relative number of NTR-hKikGR+ fluorescent signals in embryos derived from stable line assay (black bars) or transient assay (red bars). The cell number is presented as the mean±S.D. Different letters above the error bars indicate significant differences as tested using one-way ANOVA with Tukey′s pair-wise comparison method. Met, metrodinazole.