
|
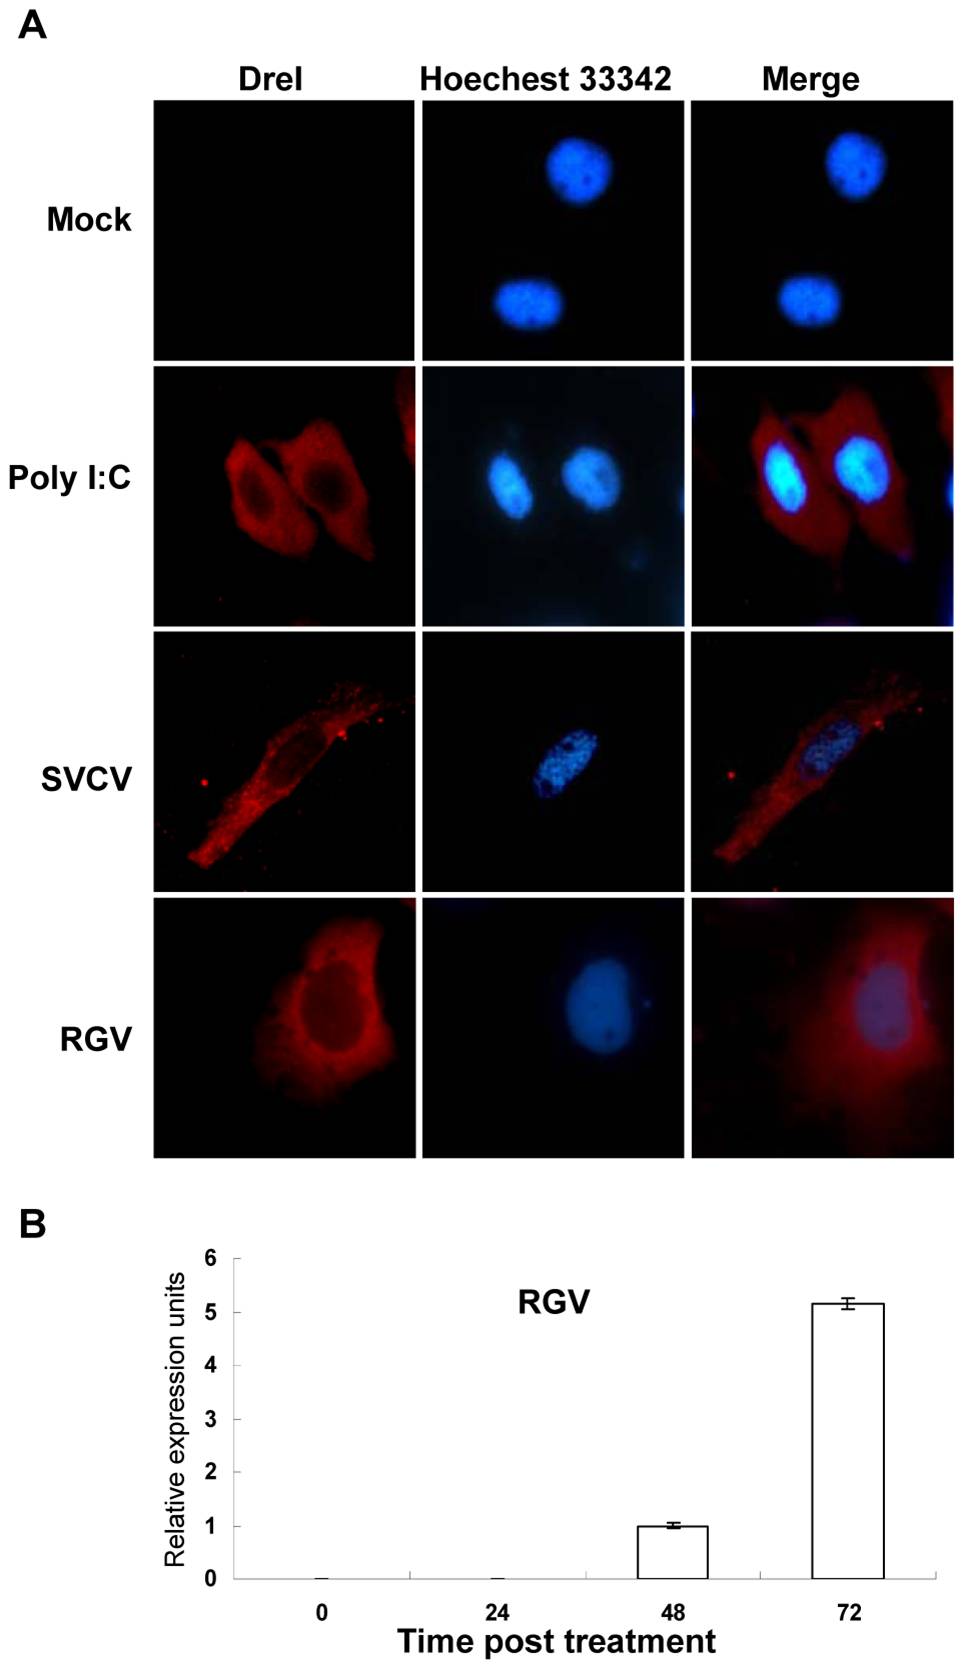
Fig. 7 Immunofluorescence localization of DreI.
(A) ZFL cells seeded on microscope cover glass in 6-well plates were stimulated with 2 μg poly I:C for 24 h, or infected with 10 TCID50 of RGV or SVCV per well for 72 h, then the cells were fixed, permeabilized, and immunoblotted with anti-DreI antiserum at 4°C overnight. The cell monolayers were further stained with Alexa Fluor 546 anti-rabbit antibody and Hoechest 33342, then examined using a Leica DM IRB fluorescence microscope. Mock-infected ZFL cells were used as a control. The red staining represented DreI protein signal and the blue indicated nucleus region. Magnification 100 (oilimmersion objective). (B) ZFL cells were infected with RGV at a dose of 10 TCID50 and were sampled at the indicated times. The relative transcript level of DreI was detected by real-time PCR and normalized to the expression of β-actin. Error bars represent SDs obtained by measuring each sample in triplicates.