
|
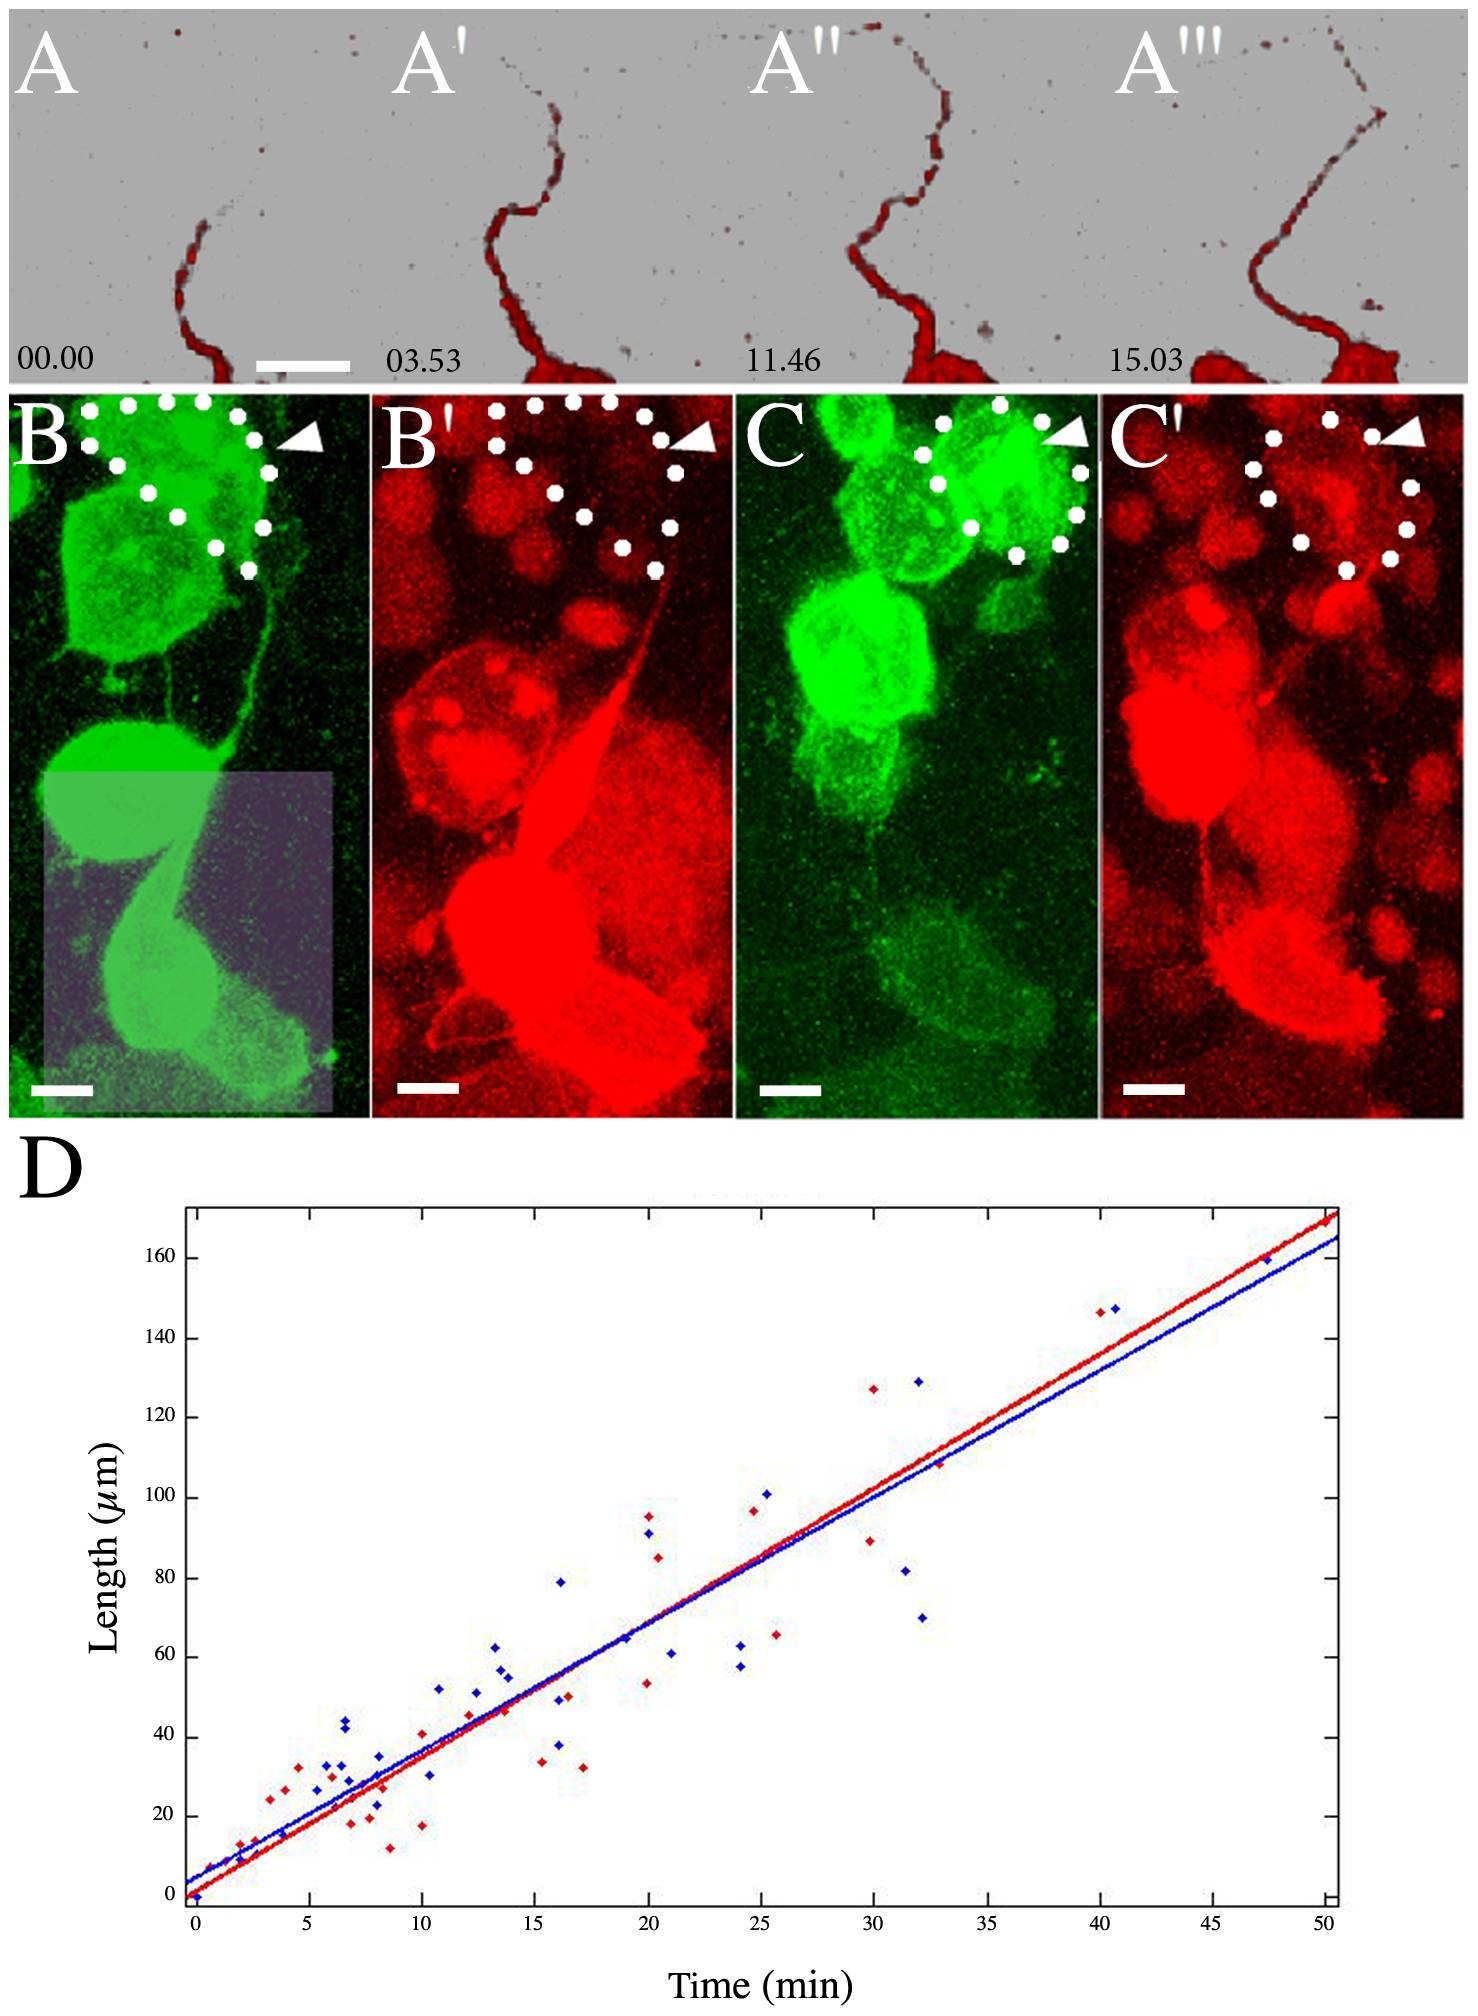
Fig. 3 Membrane Dynamics of Intercellular Bridges.
(A-A′′ ′) Time-lapse rendering of photoconverted mDendra2 diffusing along the intercellular bridges (see also: Movie S4 and S6). (B-C′) Membrane transfer of photoconverted protein in embryos labeled with mDendra2. We photoconverted mDendra2 with a 405 nm light [7], which shifts the emission and excitation spectra. (B, B′) Non-converted mDendra2 positive cells are in green (B), and photoconverted cells are in red, with H2B-mCherry highlighting the nuclei (B′). The light square in (B) shows the region of photoconversion. (C-C′) The same cells are connected via an intercellular bridge. The pool of photoconverted mDendra2 reaches the cell at the opposite end of the intercellular bridge, indicated by the white arrowhead and white dotted outline. (D) Quantification of the dynamics — length as function of time — of a pool of photoconverted mDendra2 along the intercellular bridge (time in minute and length in μm). Scattered red and blue dots represent the raw data for mDendra2 and CD8-Dendra2, respectively. The curve fitting was performed using CurveFittingTool in MATLAB, and each curve has an R2 value of at least 0.9. Scale bar (A-C′): 10 μm.