
|
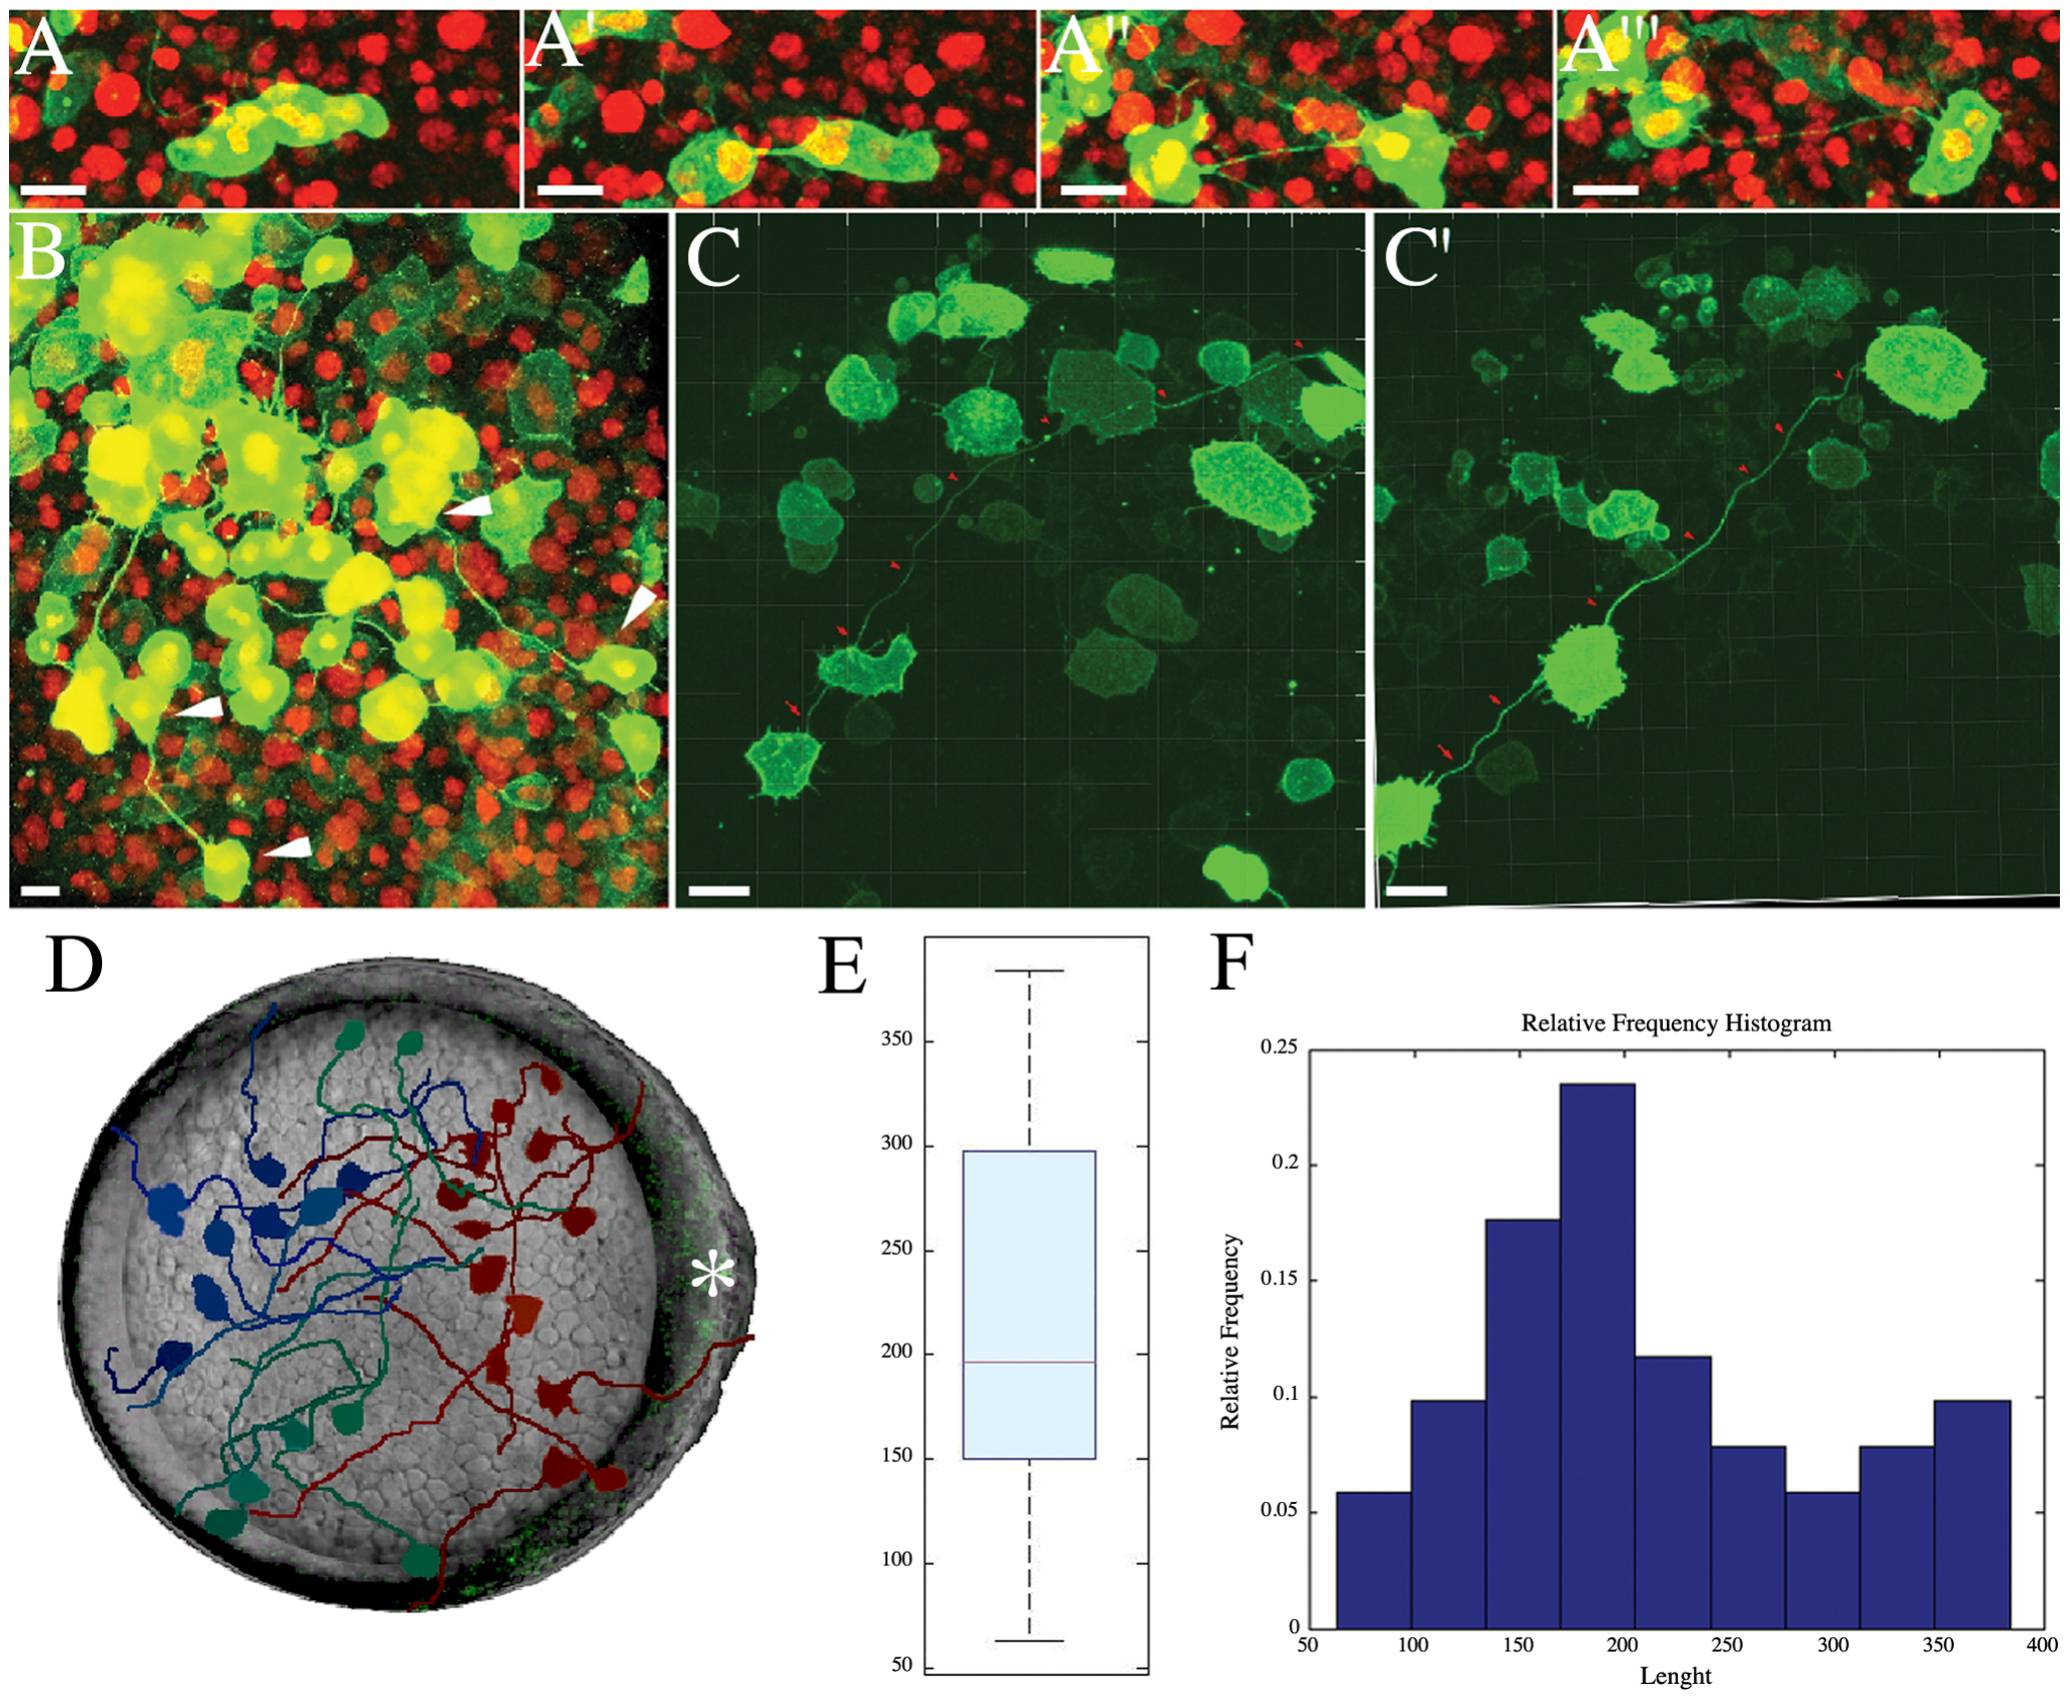
Fig. 2 Intercellular Bridge Formation and Embryo Distribution.
(A-A′′ ′) Image series from a confocal time-lapse of a dividing cell forming an intercellular bridge during the blastula stage. Nuclei are labeled with H2B-mCherry (in red) and mDendra2 (in green) highlights the cellular boundary (see also Movie S1). (B) Animal pole view of blastula zebrafish showing several pairs of interconnecting cells (white arrows). (C, C′′) Persistence of the intercellular bridge (red arrow) from mid-gastrula (C) to the end of gastrulation (C′) (see also Movie S2). (D) Schematic showing several intercellular bridges mapped in an ideal embryo, shown here in an animal pole view. Different colors show different portions of the embryos: (red) neural plate region; (dark blue) non-neural territory; (green) presumptive lateral plate. The subdivision into territories has been made aligning each embryo by the embryonic shield and the anterior neural border. The dorsal side of the idealized embryo is shown by the white asterisk (*). (E, F) Quantification of the length of the intercellular bridges at midgastrula. (E) The boxplot shows the median length of intercellular bridges (red line). The first quartile (blue box) and the minimum and maximum value of the intercellular bridges (whiskers) are depicted for a total of n = 30 cells from 20 independent embryos. The average length of the intercellular bridges is 215 μm. (F) The histogram shows the same distribution represented in the boxplot. Scale bar (A-C′): 20 μm.