
|
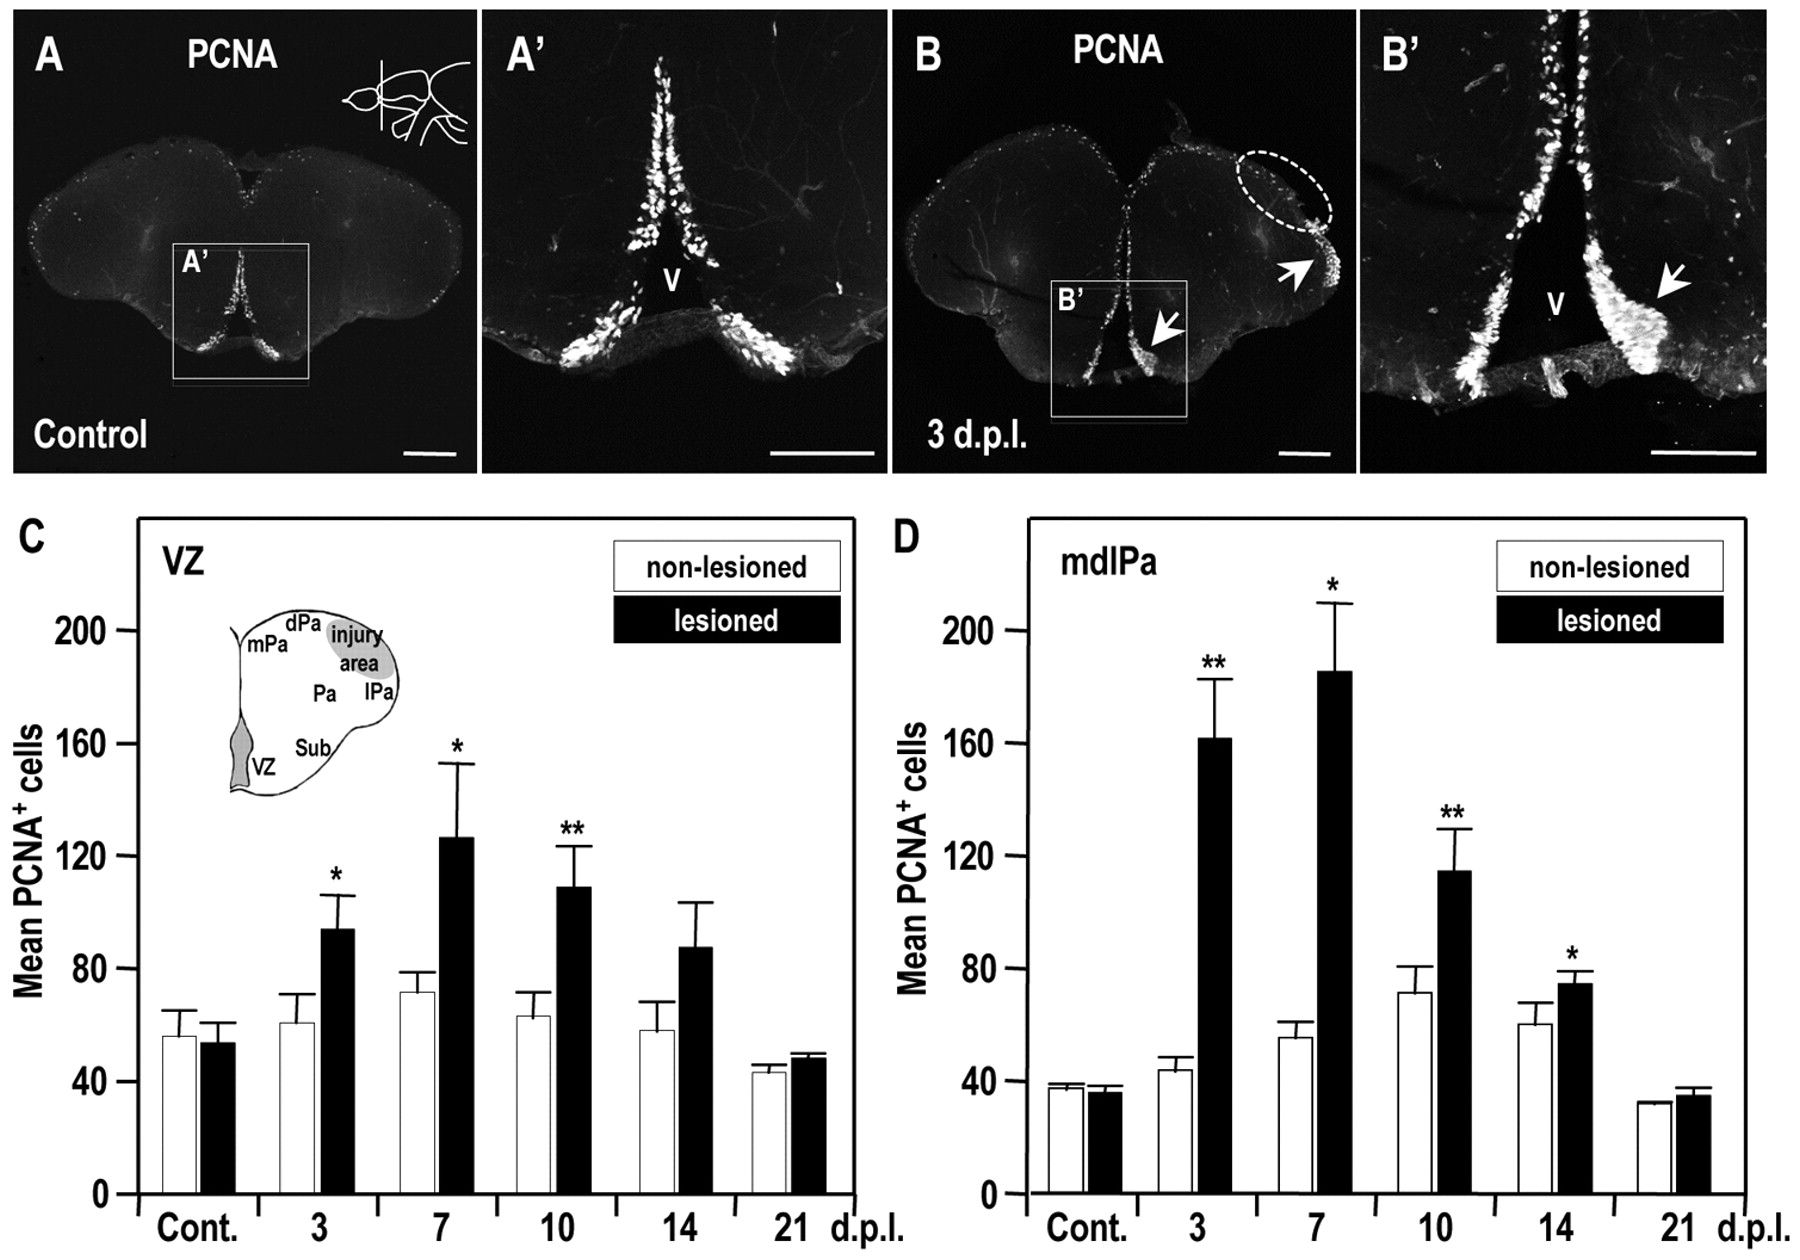
Fig. 2 Cell proliferation induced by telencephalon injury. (A,B) Immunodetection of PCNA in coronal brain sections at the level indicated in the illustration in panel A (dorsal up): (A) control; (B) 3 dpl. Higher magnifications of panels A and B are shown in A′ and B′, respectively. Notice the injury-induced cell proliferation in the vicinity of the injury site (B) and in the telencephalic ventricular zone (B′). Arrows show the zones where cell proliferation was induced by injury. White dotted circles indicate the injury site. V, telencephalic ventricle. Scale bars: 100 μm. (C,D) Histograms showing the PCNA-positive cell counts in the telencephalic ventricular zone (C), and in the medial-dorsal-lateral domain of the telencephalic pallium (mdlPa) (D) over time. Student’s t-test was used to determine significant differences in expression. Error bars represent s.e.m. *P<0.05, **P<0.01. VZ, ventricular zone; Sub, subpallium; Pa, pallium; mPa, medial pallium; dPa, dorsal pallium; lPa, lateral pallium.