
Image
|
Figure Caption
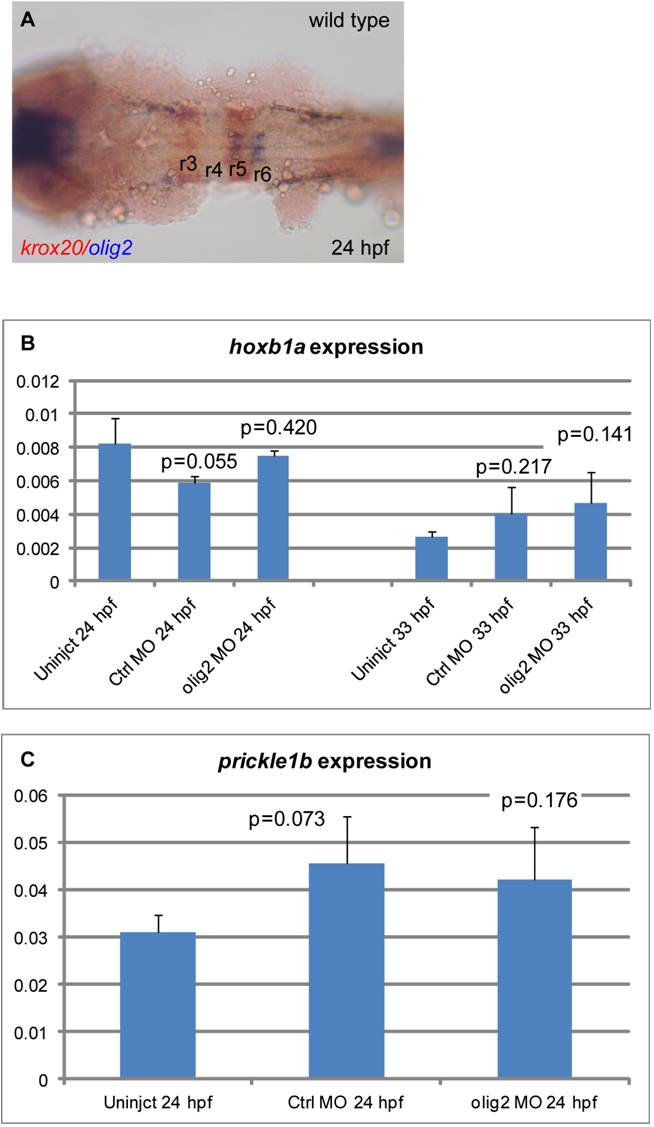
Fig. S4 olig2 is not expressed in r4 and olig2 loss of function has no effect on hoxb1a or prickle1b expression. A: Wild-type expression at 22 hpf of olig2 in r5 and r6 in blue and egr2b in r3 and r5 in red. B: qPCR of hoxb1a expression in wild-type, control MO-injected, and olig2 MO-injected embryos at 24 and 33 hpf. C: qPCR of prickel1b expression in wild type, control MO-injected, and olig2 MO-injected embryos at 24 hpf. Error bars represent standard deviation. P value calculated by Student′s t-test is listed above each bar and compared to wild-type embryos.
Acknowledgments
This image is the copyrighted work of the attributed author or publisher, and
ZFIN has permission only to display this image to its users.
Additional permissions should be obtained from the applicable author or publisher of the image.
Full text @ Dev. Dyn.