
|
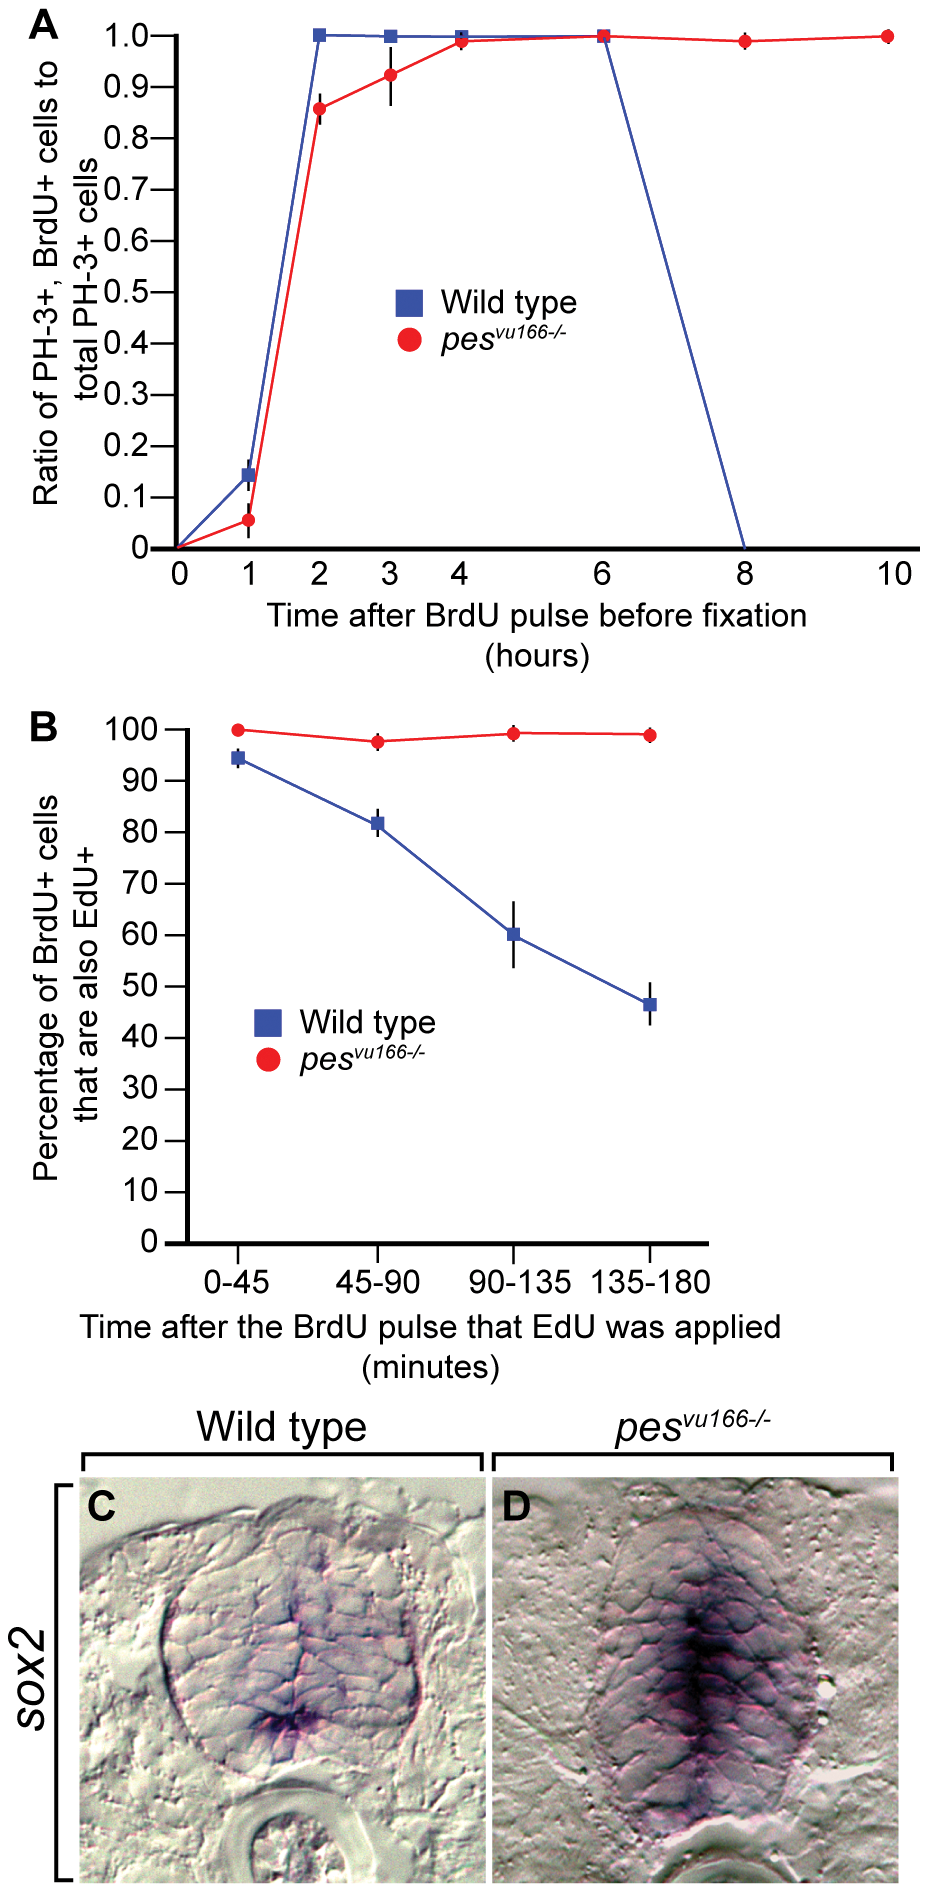
Fig. 5
Loss of pes function disrupts progression of spinal cord cells through the cell cycle.
(A) The time required to progress from S-phase to M-phase in the spinal cord is shown by the ratio of PH-3+/BrdU+ to total PH-3+ cells at the indicated time points after a BrdU pulse. (B) The length of S-phase in the spinal cord is shown by the ratio of BrdU+/EdU+ cells to total BrdU+ cells at the indicated time points after a BrdU pulse. Wild-type (blue) and pes166 -/- (red) are shown. (C,D) Transverse sections through spinal cords of 4 dpf wild-type (C) and mutant (D) larvae processed for in situ RNA hybridization showing the expression of the neural precursor marker sox2.