
|
Fig. 5
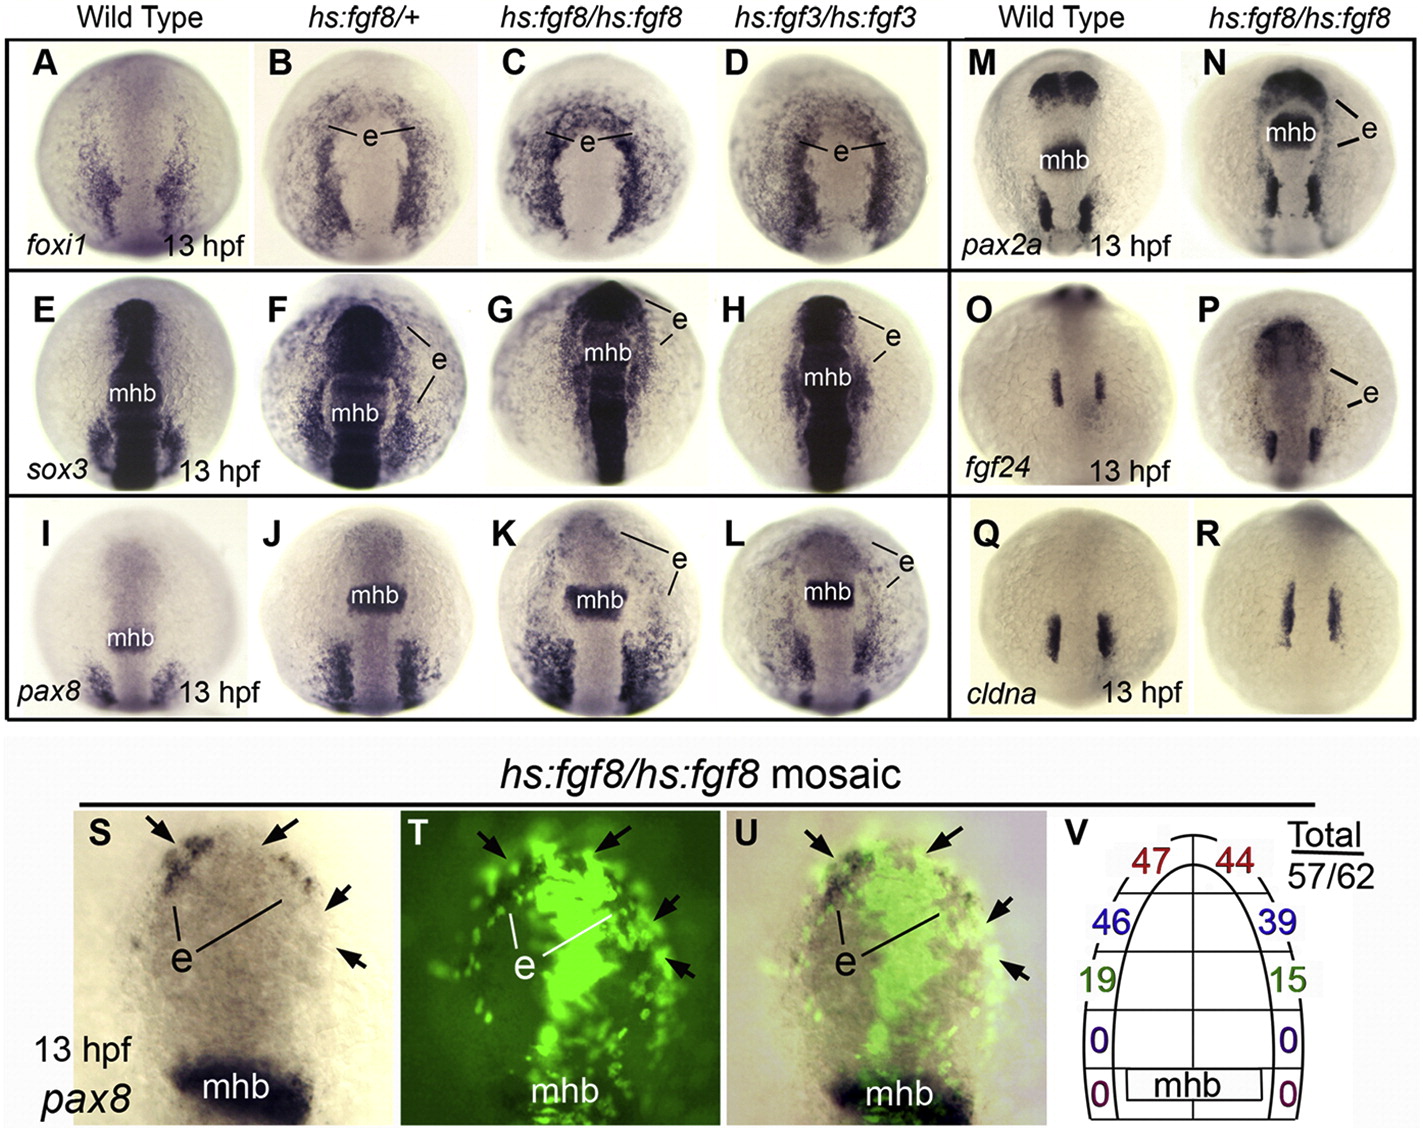
High level Fgf induces ectopic expression of otic markers in anterior preplacodal ectoderm after gastrulation. (A–R) Dorsal views (anterior up) of embryos heat shocked at 39 °C for 1 h starting at 10 hpf and then fixed at 13 hpf to examine expression of foxi1 (A–D), sox3 (E–H), pax8 (I–J), pax2a, (M, N), fgf24 (O, P) and cldna (Q, R). Genotypes of embryos are indicated across the top of the figure. The midbrain–hindbrain border (mhb) and regions showing ectopic expression (e) are indicated. (S–U) A representative hs:fgf8/hs:fgf8 mosaic embryo that was heat shocked at 39 °C for 1 h at 10 hpf and fixed at 13 hpf to examine pax8 expression. Images show the same specimen viewed under bright field (S), fluorescence (T), and an overlay (U). Positions of hs:fgf8/hs:fgf8 transgenic cells (green, black arrows), the midbrain–hindbrain border (mhb), and ectopic patches of pax8 expression (e) are indicated. (V) A summary diagram showing the number of hs:fgf8/hs:fgf8 mosaic embryos with ectopic expression of pax8 in different regions of the preplacodal ectoderm. The total number of mosaic embryos showing any ectopic pax8 divided by the total number examined is also indicated.
Reprinted from Developmental Biology, 364(1), Padanad, M.S., Bhat, N., Guo, B., and Riley, B.B., Conditions that influence the response to Fgf during otic placode induction, 1-10, Copyright (2012) with permission from Elsevier. Full text @ Dev. Biol.