
Image
|
Figure Caption
Fig. 2 In Vivo Imaging of Synaptic Transmission in the Retina
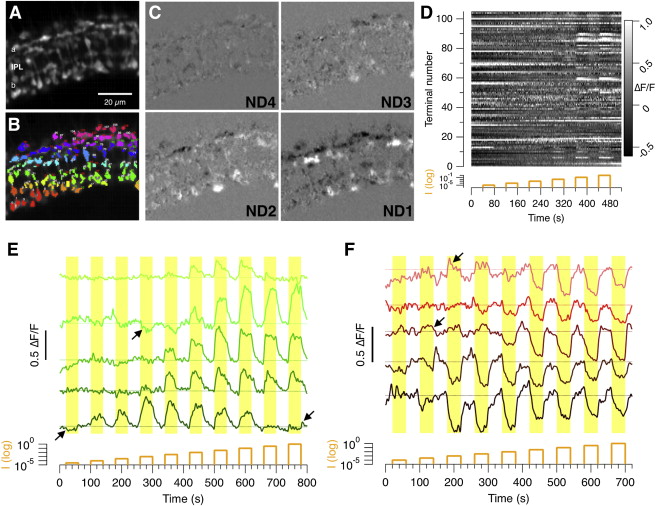
(A) Field of view showing sypHy expression in synaptic terminals of bipolar cells in the IPL of a fish at 10 dpf.(B) ROIs from the same field highlighted in different colors. When viewed at highest resolution, numbers mark ON terminals and red numbers OFF. Nonresponding terminals numbered in white.(C) Difference images highlighting the change in sypHy fluorescence in response to steps of light. Attenuation of the light source is shown in log units (ND 4 to ND 1). Darker areas show OFF terminals; brighter areas are ON.(D) Raster plot showing the relative change in fluorescence (ΔF/F) for each ROIs marked in (B). The intensity of the stimulus was increased in steps of 1 log unit, with a maximum intensity of 5.5 × 10⁵ photons/μm2/s.(E) Responses of five individual ON terminals to light steps increasing in intensity by 0.5 log units. Darker hues indicate more sensitive terminals. The black arrows highlight some examples of switches in response polarity.(F) Responses of five individual OFF terminals (see also Figure S2).
Acknowledgments
This image is the copyrighted work of the attributed author or publisher, and
ZFIN has permission only to display this image to its users.
Additional permissions should be obtained from the applicable author or publisher of the image.
Full text @ Neuron