
Image
|
Figure Caption
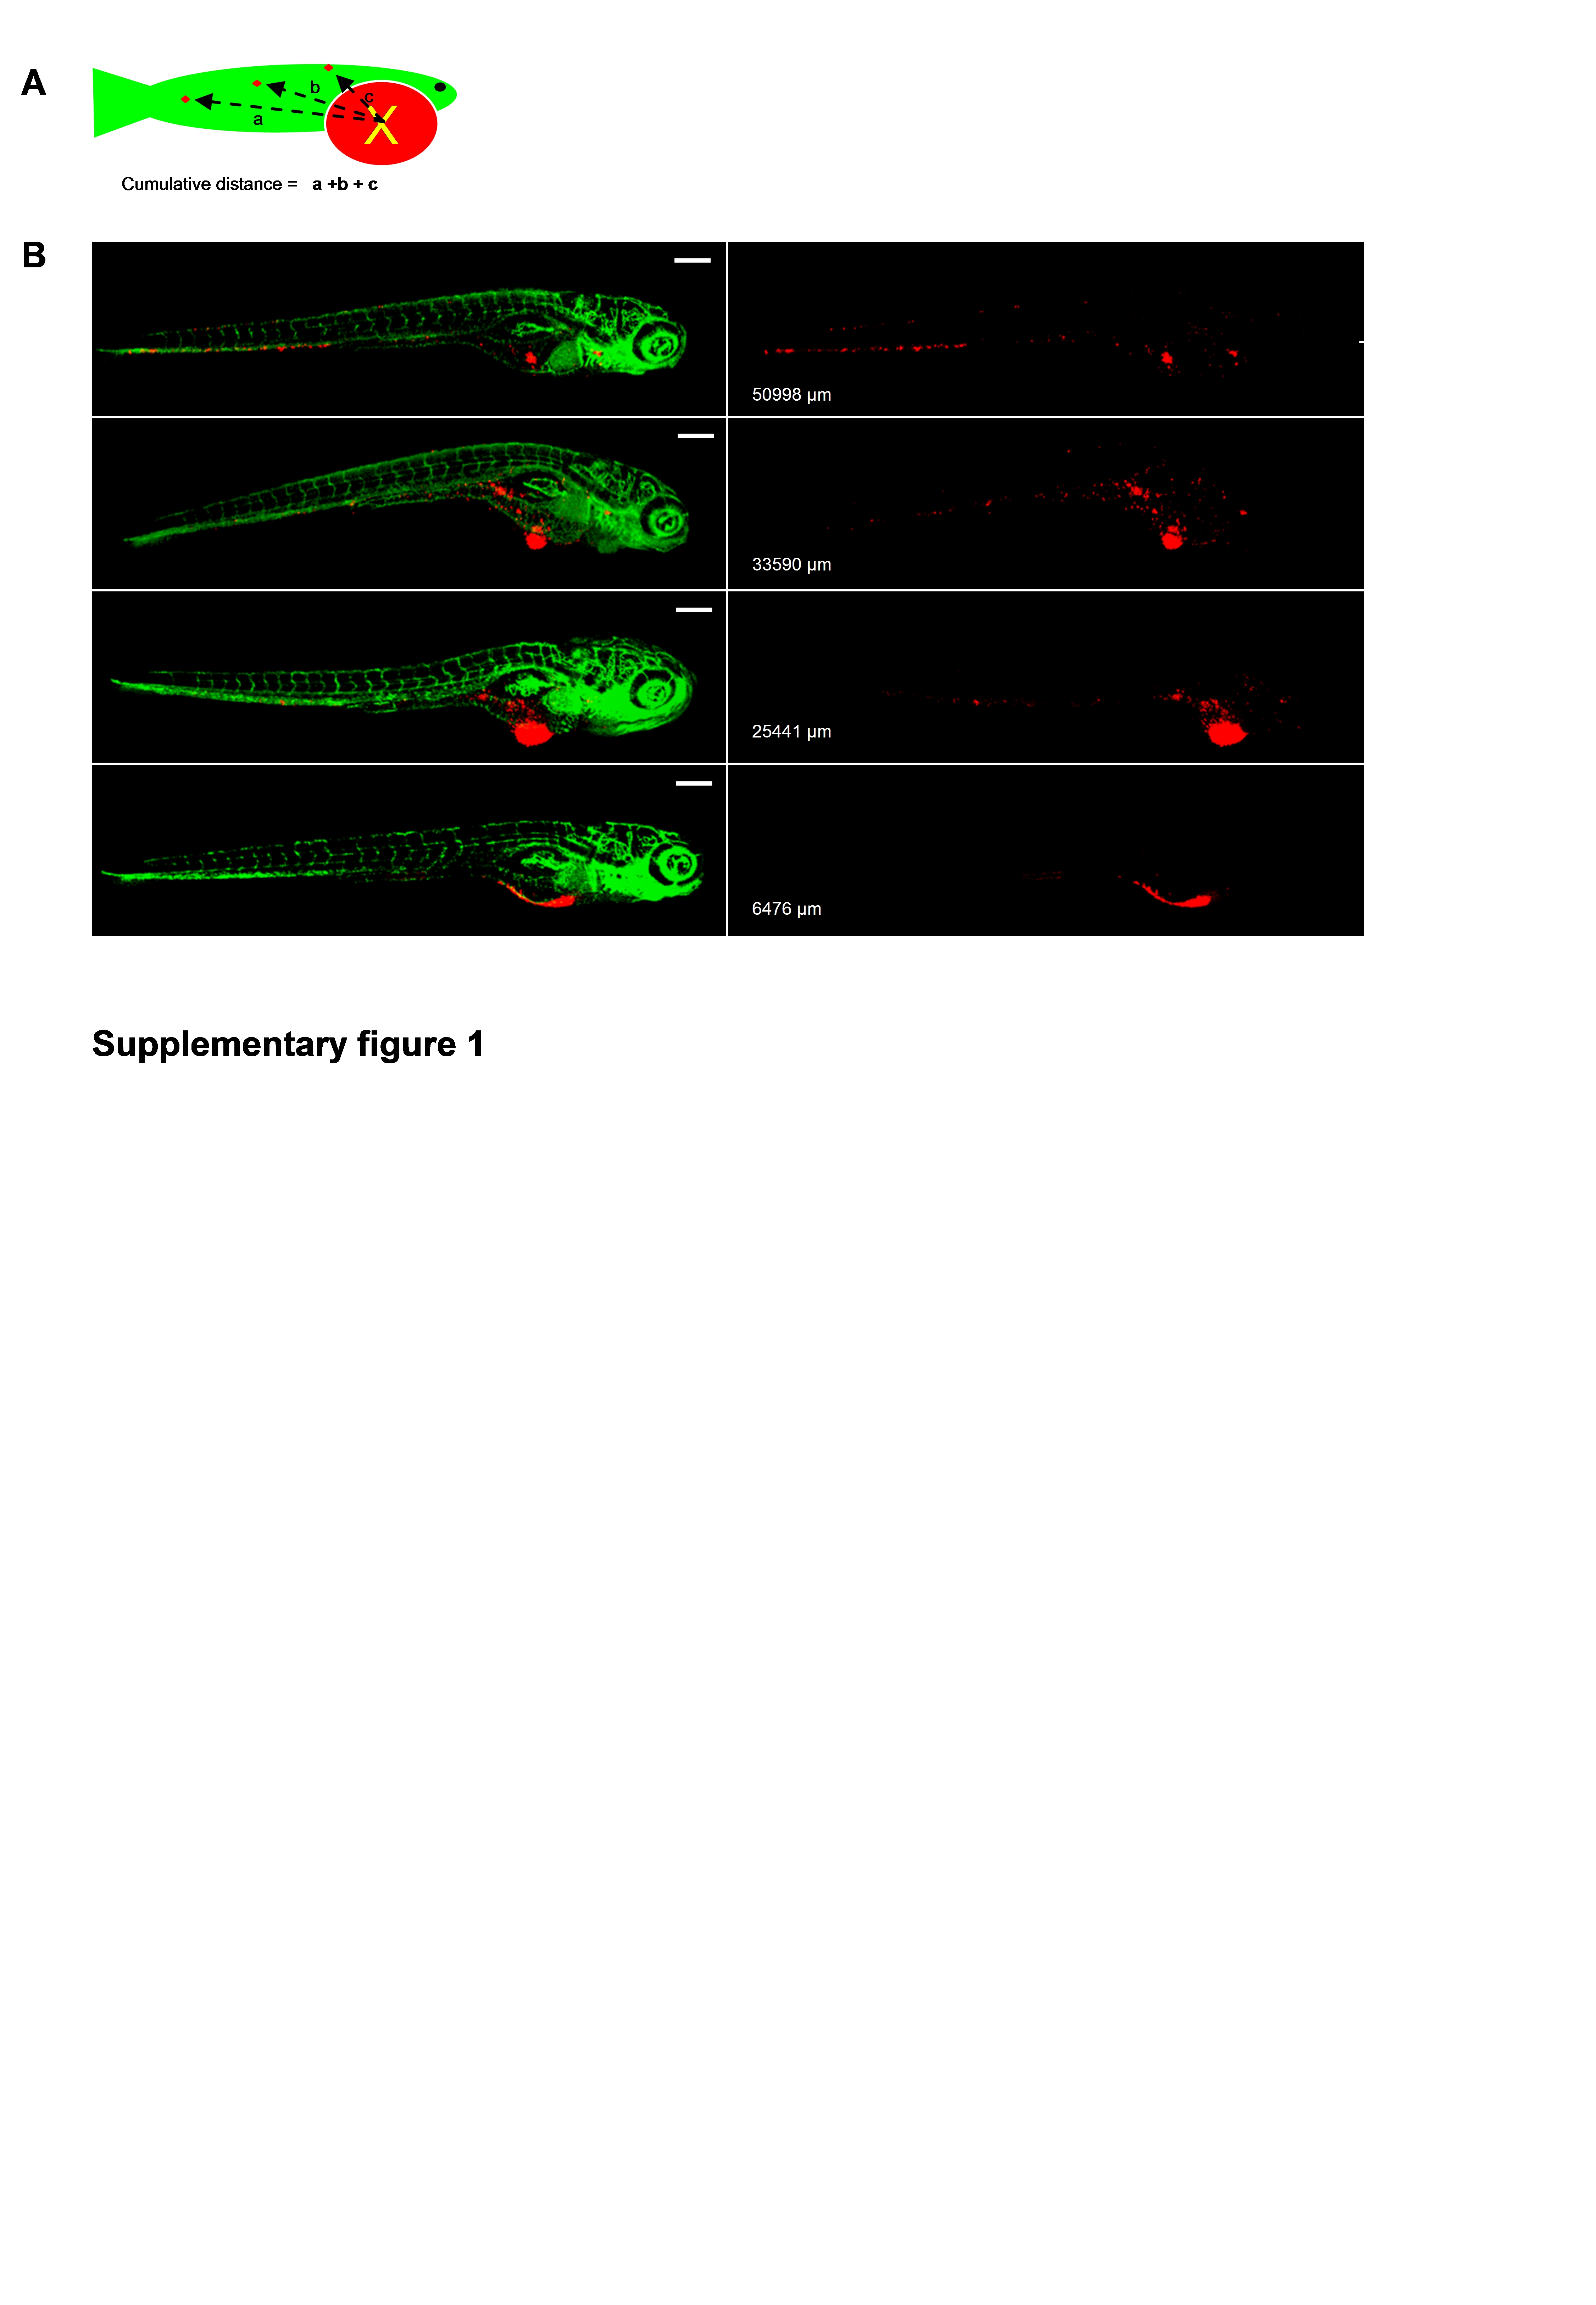
Fig. S1
Automatically calculated cumulative distance (CD) in 6 dpi PC3 implanted embryos correlates with visual inspection of tumor cell dissemination. A, Scheme depicting concept of CD of tumor cell-foci. B, left images show CM-DiI-labeled tumor cells in red and GFP-endothelial cells of the Tg (Fli:GFP) line in green. Right images show only CM-DiI signal and calculated CD is indicated for each embryo.
Acknowledgments
This image is the copyrighted work of the attributed author or publisher, and
ZFIN has permission only to display this image to its users.
Additional permissions should be obtained from the applicable author or publisher of the image.
Full text @ PLoS One