
|
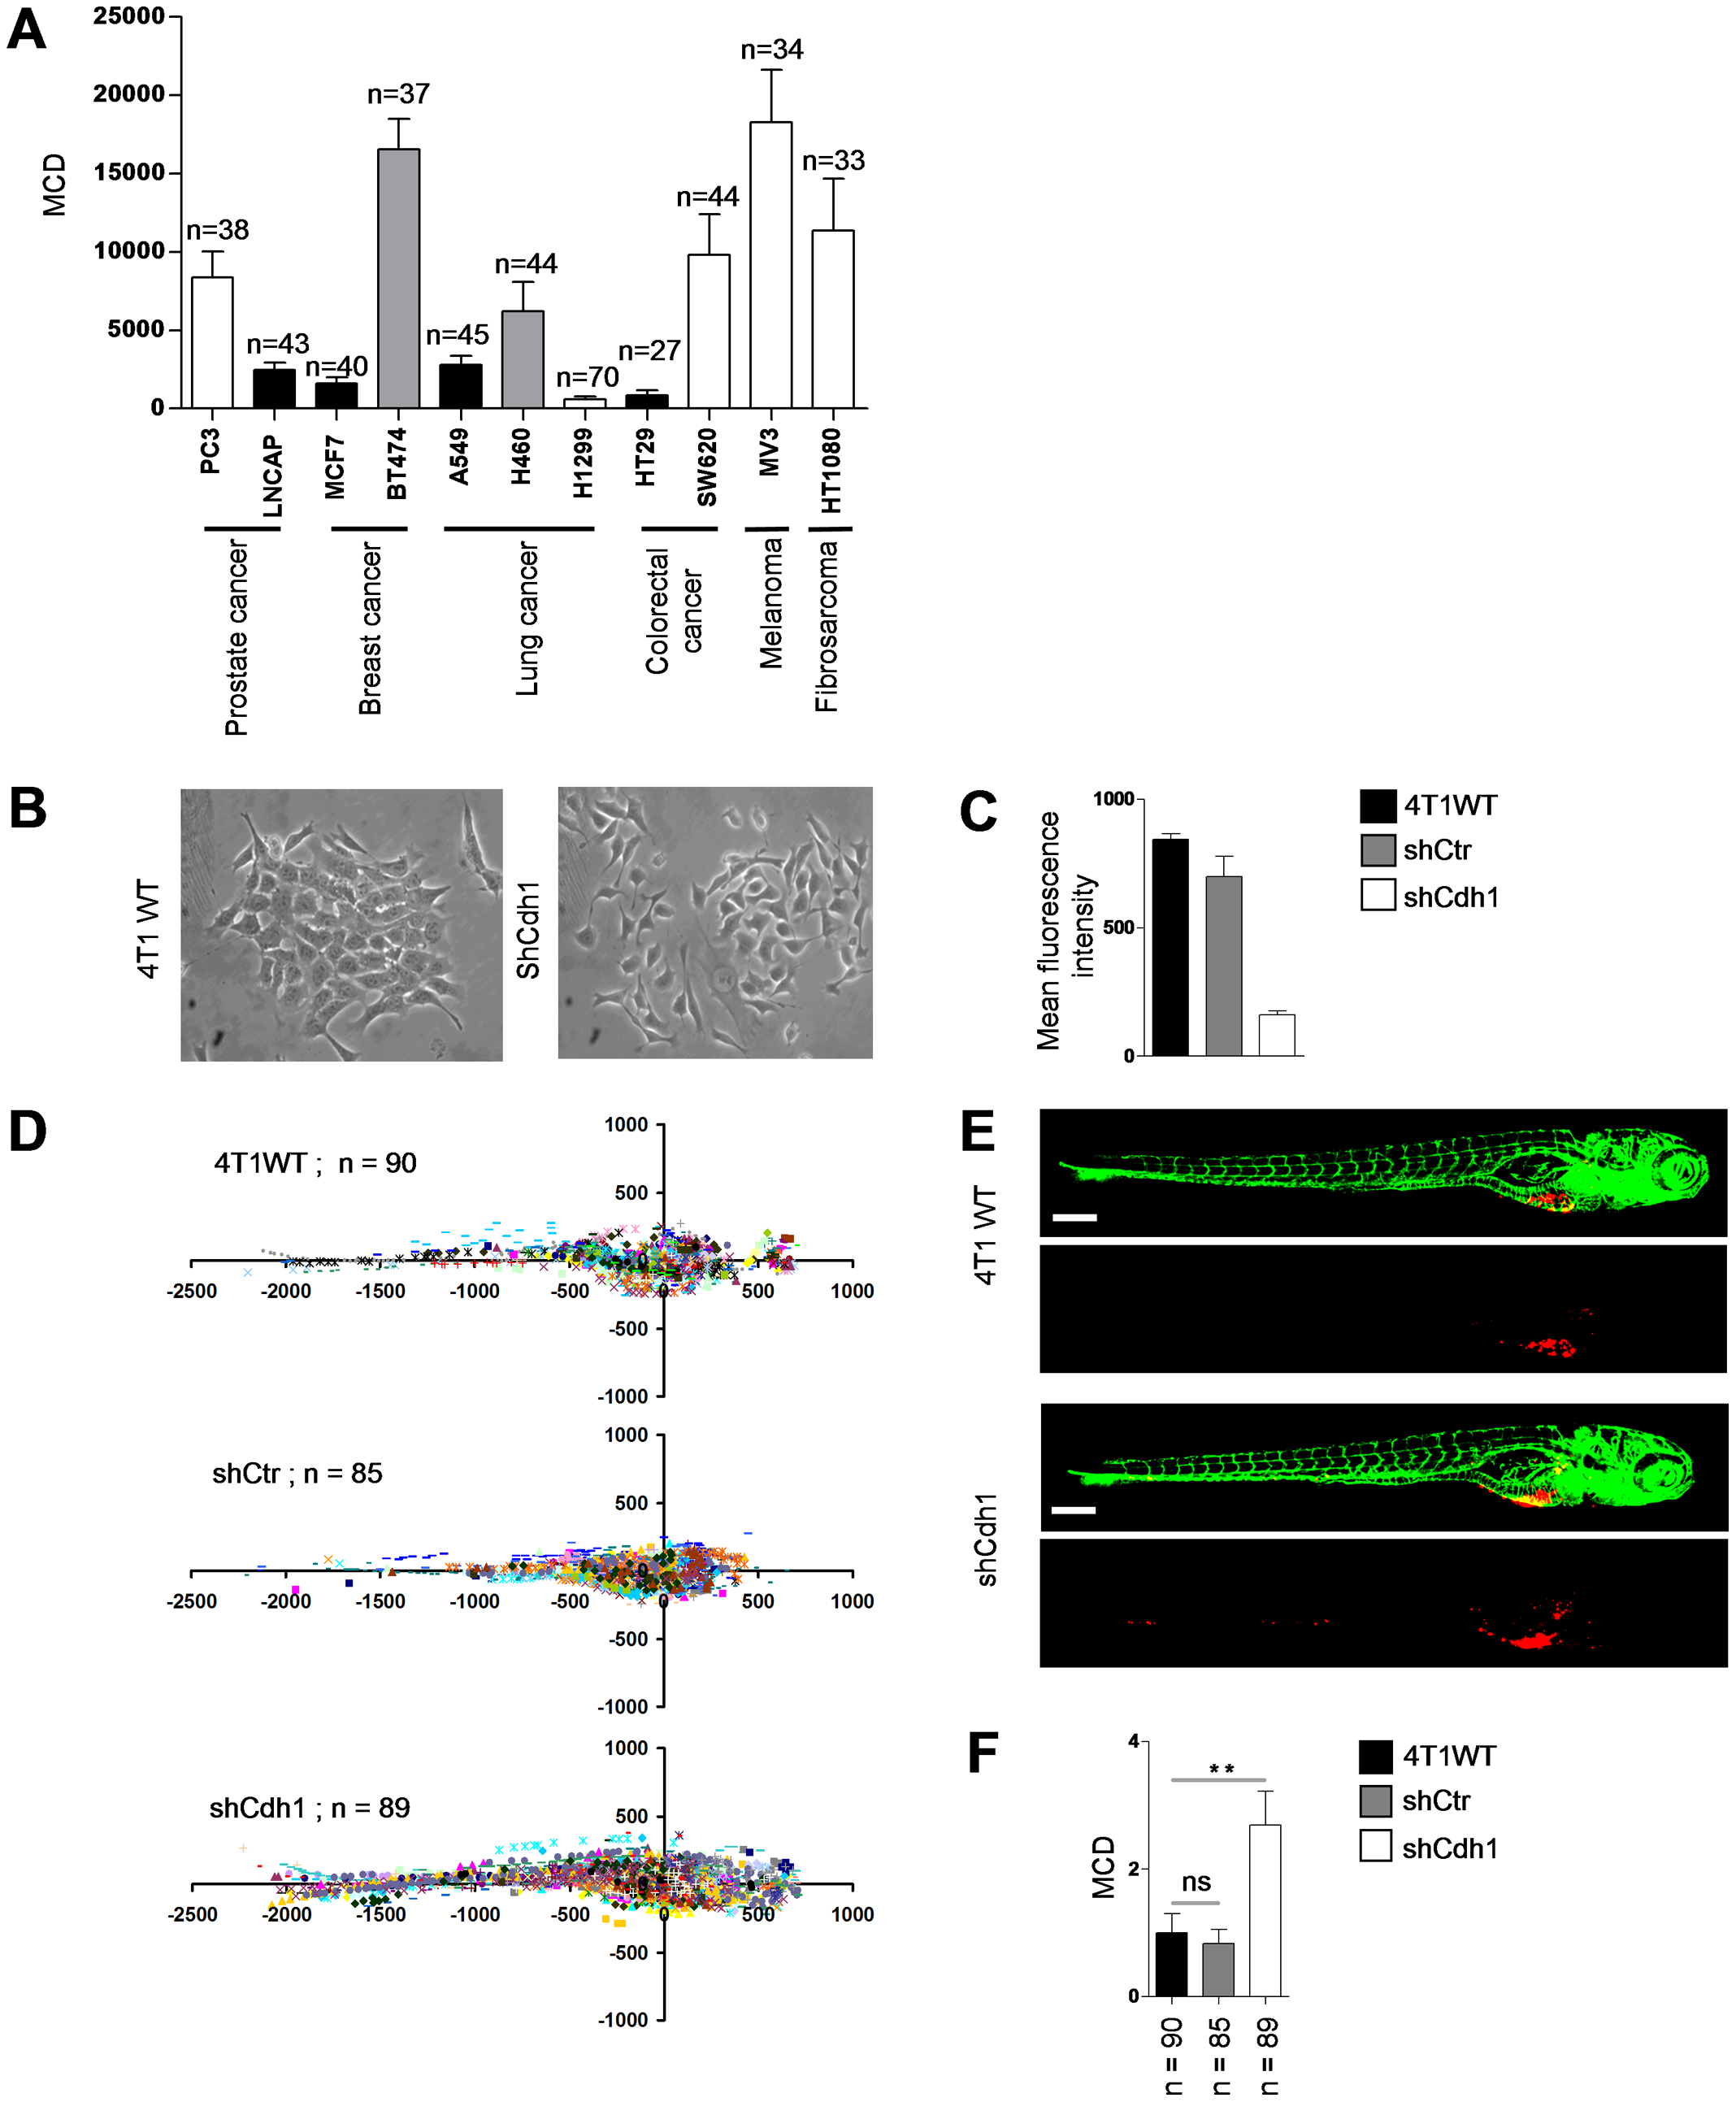
Fig. 8
Differentiation between epithelial and mesenchymal cell types using the automated bioimaging assay.
(A) MCD in a panel of human cancer cell lines from different origins. Number of injected embryos is indicated. White bars indicate cell lines showing a scattered phenotype in 2D cell culture. Black bars indicate cell lines growing as epithelial islands in 2D culture. Grey bars indicate cell lines with intermediate/mixed epithelial/mesenchymal characteristics. (B) 4T1 breast cancer cells growing as islands of loosely attached spindle-shaped cells (left) and completely scattered growth of 4T1 cells following E-cadherin silencing (right). (C) E-cadherin surface expression by FACS. (D) Scatter plot representation of indicated 4T1 variants. Number of injected embryos from 2 independent experiments is shown. (E) Representative images of embryos injected with indicated 4T1 variants. (F) MCD determined from data represented in D. Data are presented relative to wild type 4T1 as mean ± s.e.m. **p<0.01. Scale bar is 200 μm in E.