
|
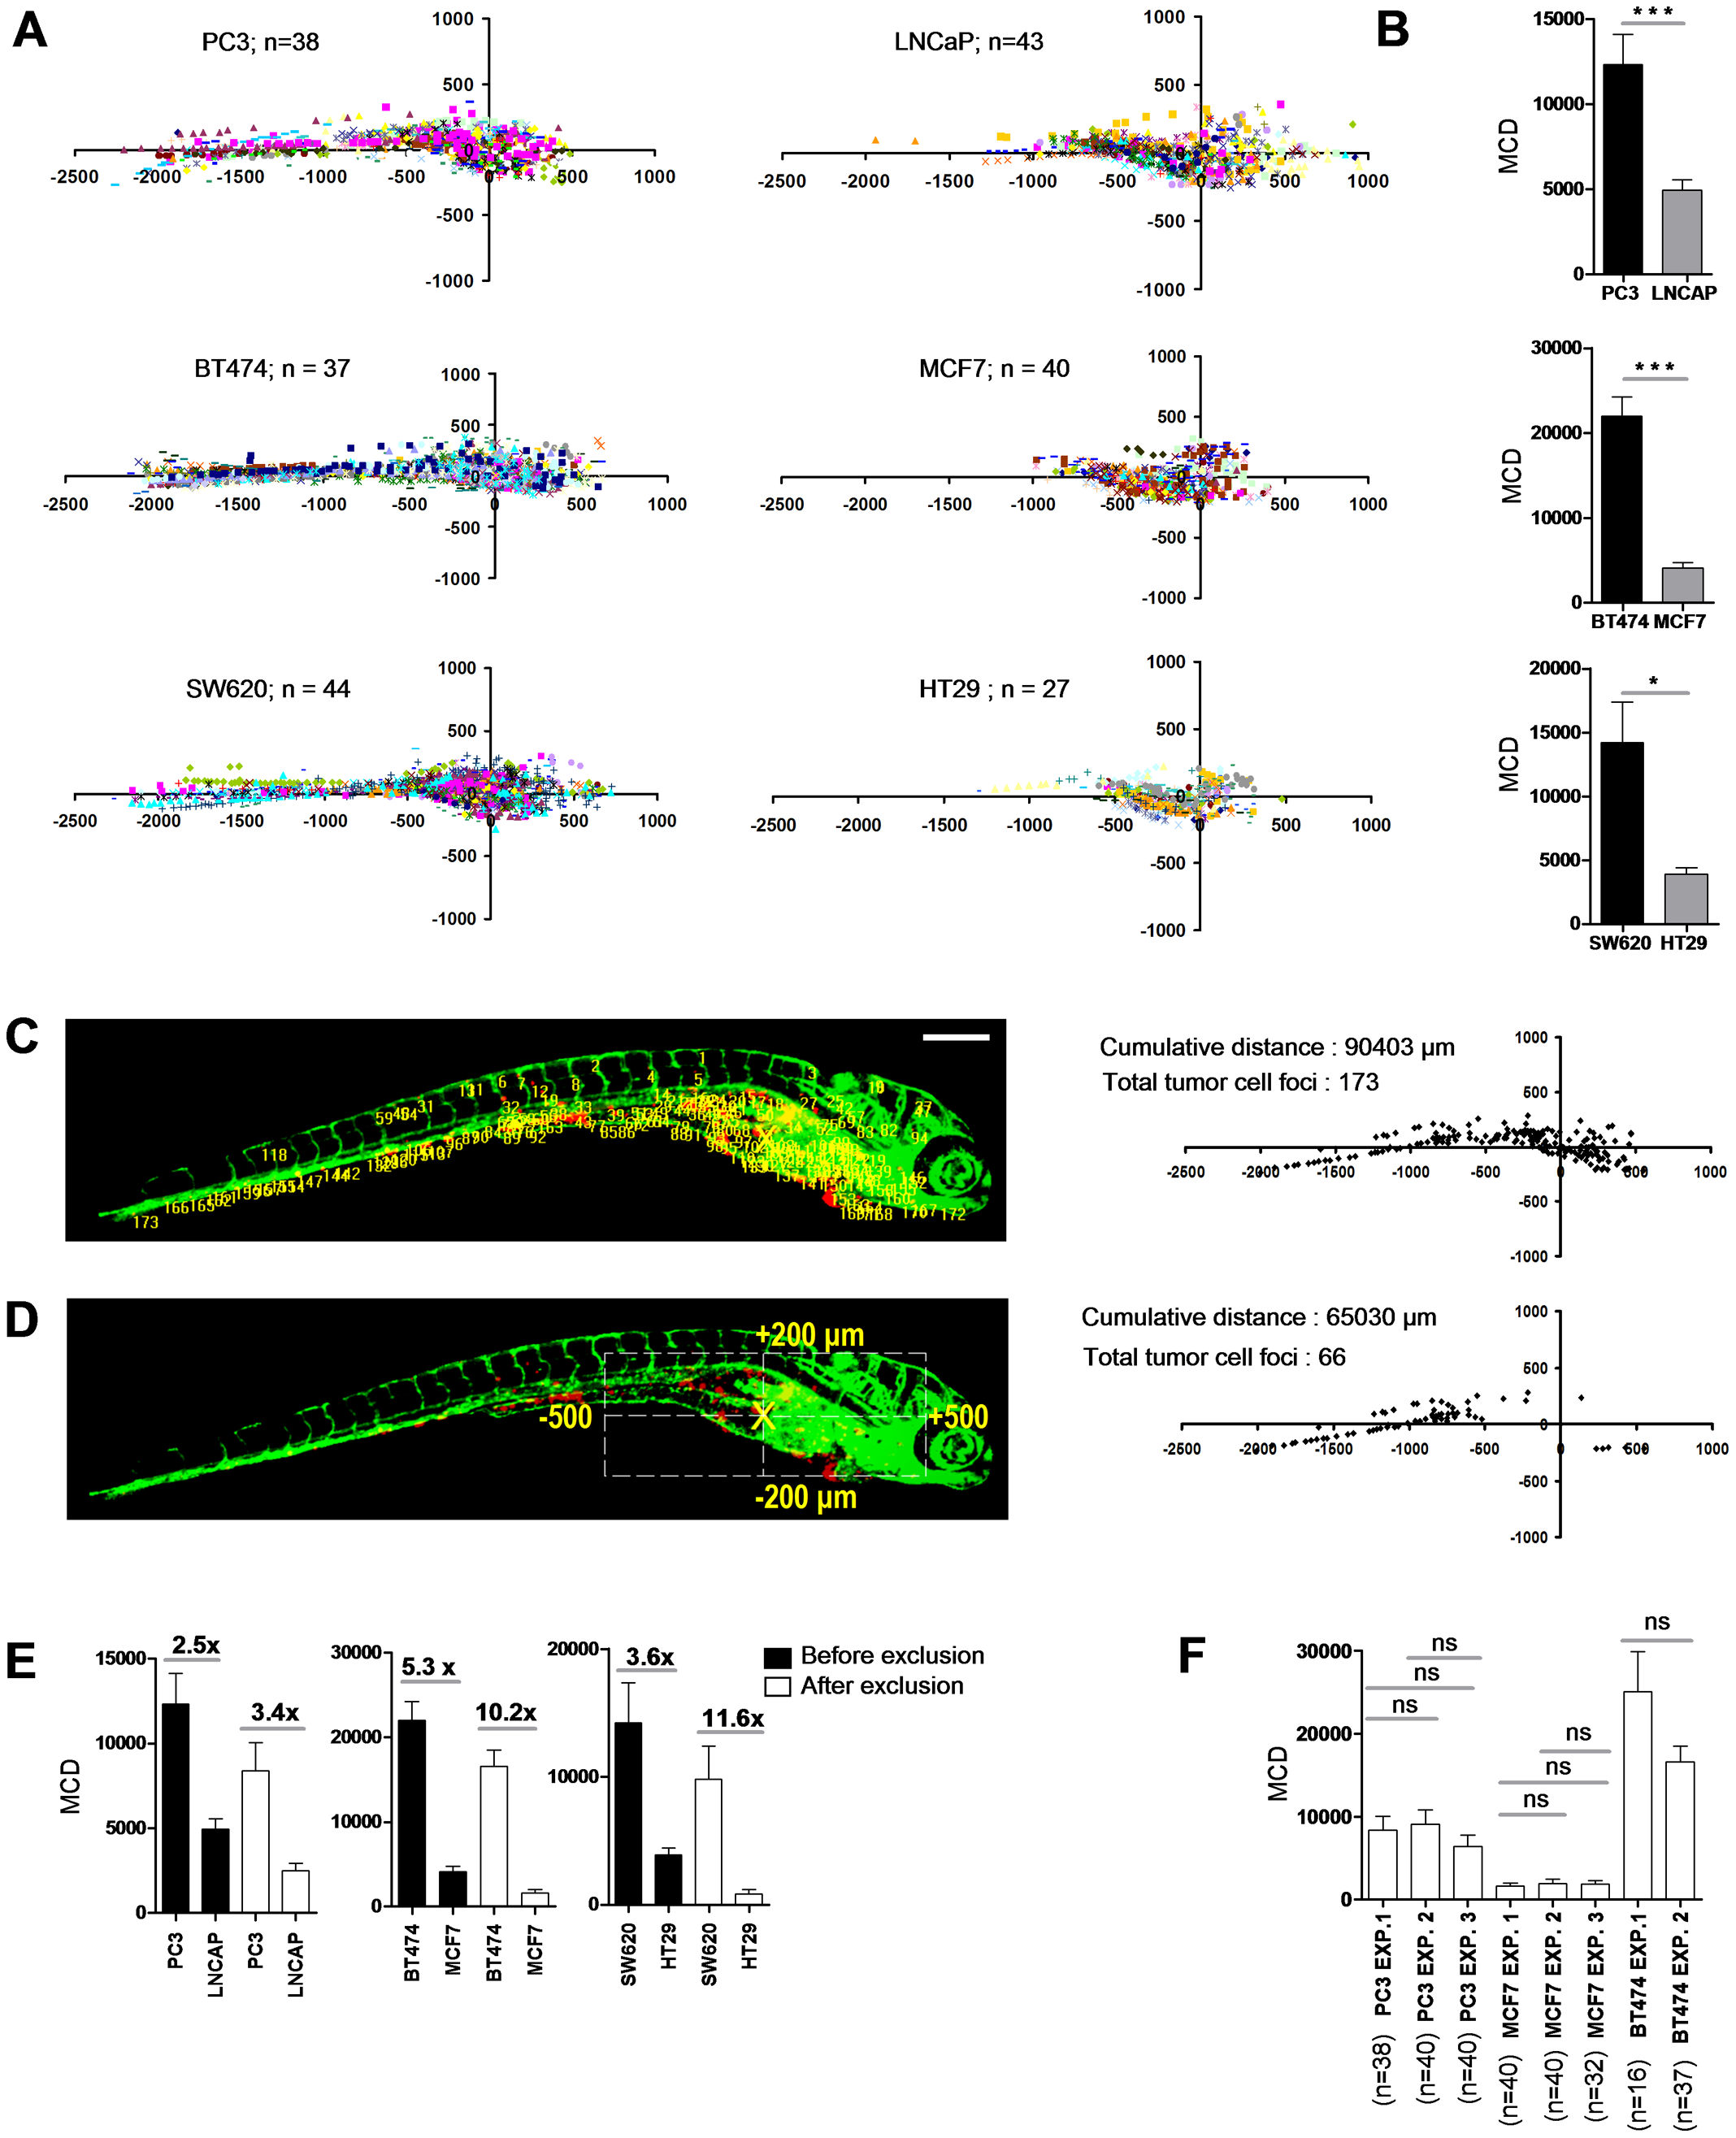
Fig. 7
Differentiation between poorly and highly aggressive human cancer cell lines using automated bioimaging assay.
(A) Scatter plot representation of tumor cell dissemination for indicated prostate (upper graphs), breast (middle), and colorectal cancer cell lines (lower graphs). Number of injected embryos from 2 biological replicates is indicated. (B) MCD determined from data represented in A. Data are presented as mean ± s.e.m. *p<0.05, ***p<0.001. (C) 6 dpi embryo injected with PC3 showing tumor foci burden determined from segmented red channel (left), and represented as scatter plot (right). (D) Automated determination of region for exclusion of tumor foci around implantation site and in area of intestinal development (left), and remaining tumor foci represented as scatter plot (right). (E) MCD before (black) and after exclusion (white bars) for the indicated prostate (left), breast (middle), and colorectal cancer lines (right graph). Fold difference between poorly and highly aggressive cell lines is indicated. Data are presented as mean ± s.e.m. *p<0.05, ***p<0.001. (F) MCD after exclusion for PC3 and MCF7 in multiple independent experiments demonstrates reproducibility. Data are presented as mean ± s.e.m.