
|
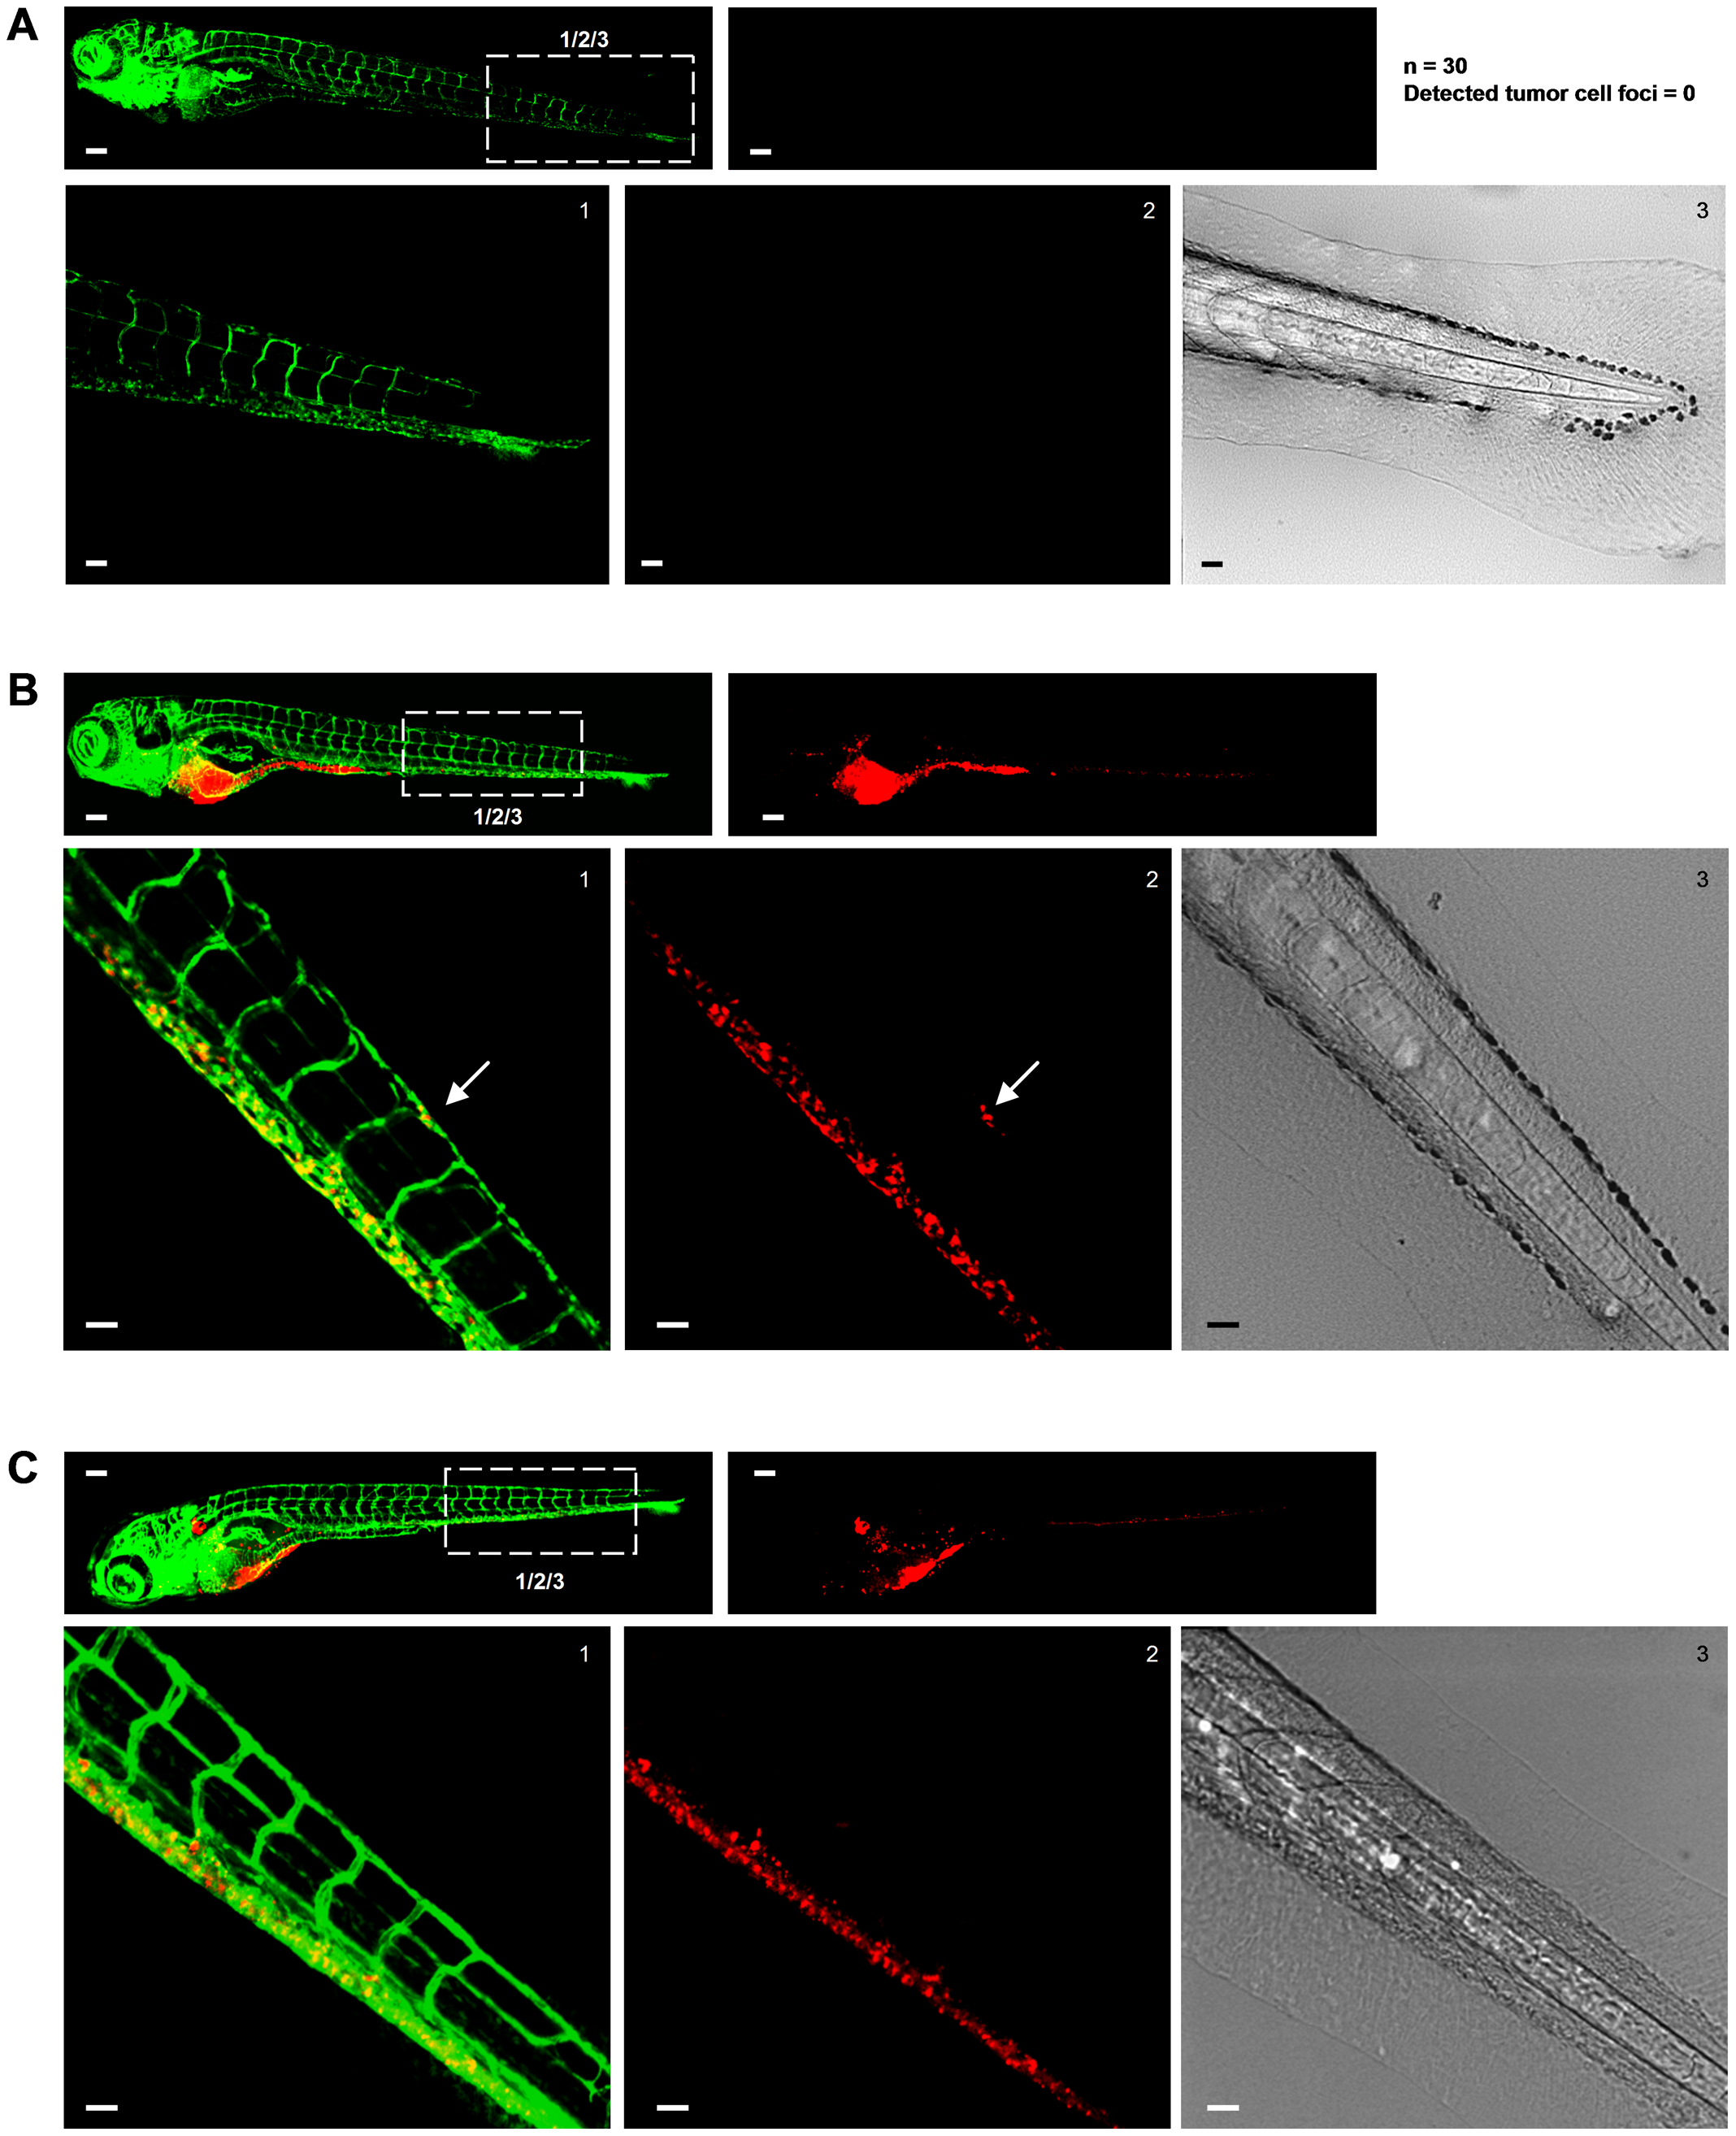
Fig. 6
Excluding disturbance of the image analysis by autofluorescence signal from pigment cells.
(A–C) In each case top left image shows green signal (Fli-EGFP) and top right image shows red signal for tumor cells. Bottom images show zooms of boxed area in top left image providing green (left) and red signal (middle) and transmitted light (right). Scale bar is 100 μm in images showing whole embryo and 50 μm in zoomed images. (A) Non-implanted fli-EGFP embryo imaged at 8 days post fertilization. Number of non-implanted embryos and number of tumor cells (falsely) detected by automated imaging and image analysis method is indicated at the right. (B) Fli-EGFP embryo implanted with CM-DiI-labeled PC3 imaged at 6 dpi. (C) Fli-EGFP Casper embryo implanted with CM-DiI-labeled PC3 imaged at 6 dpi.