
Image
|
Figure Caption
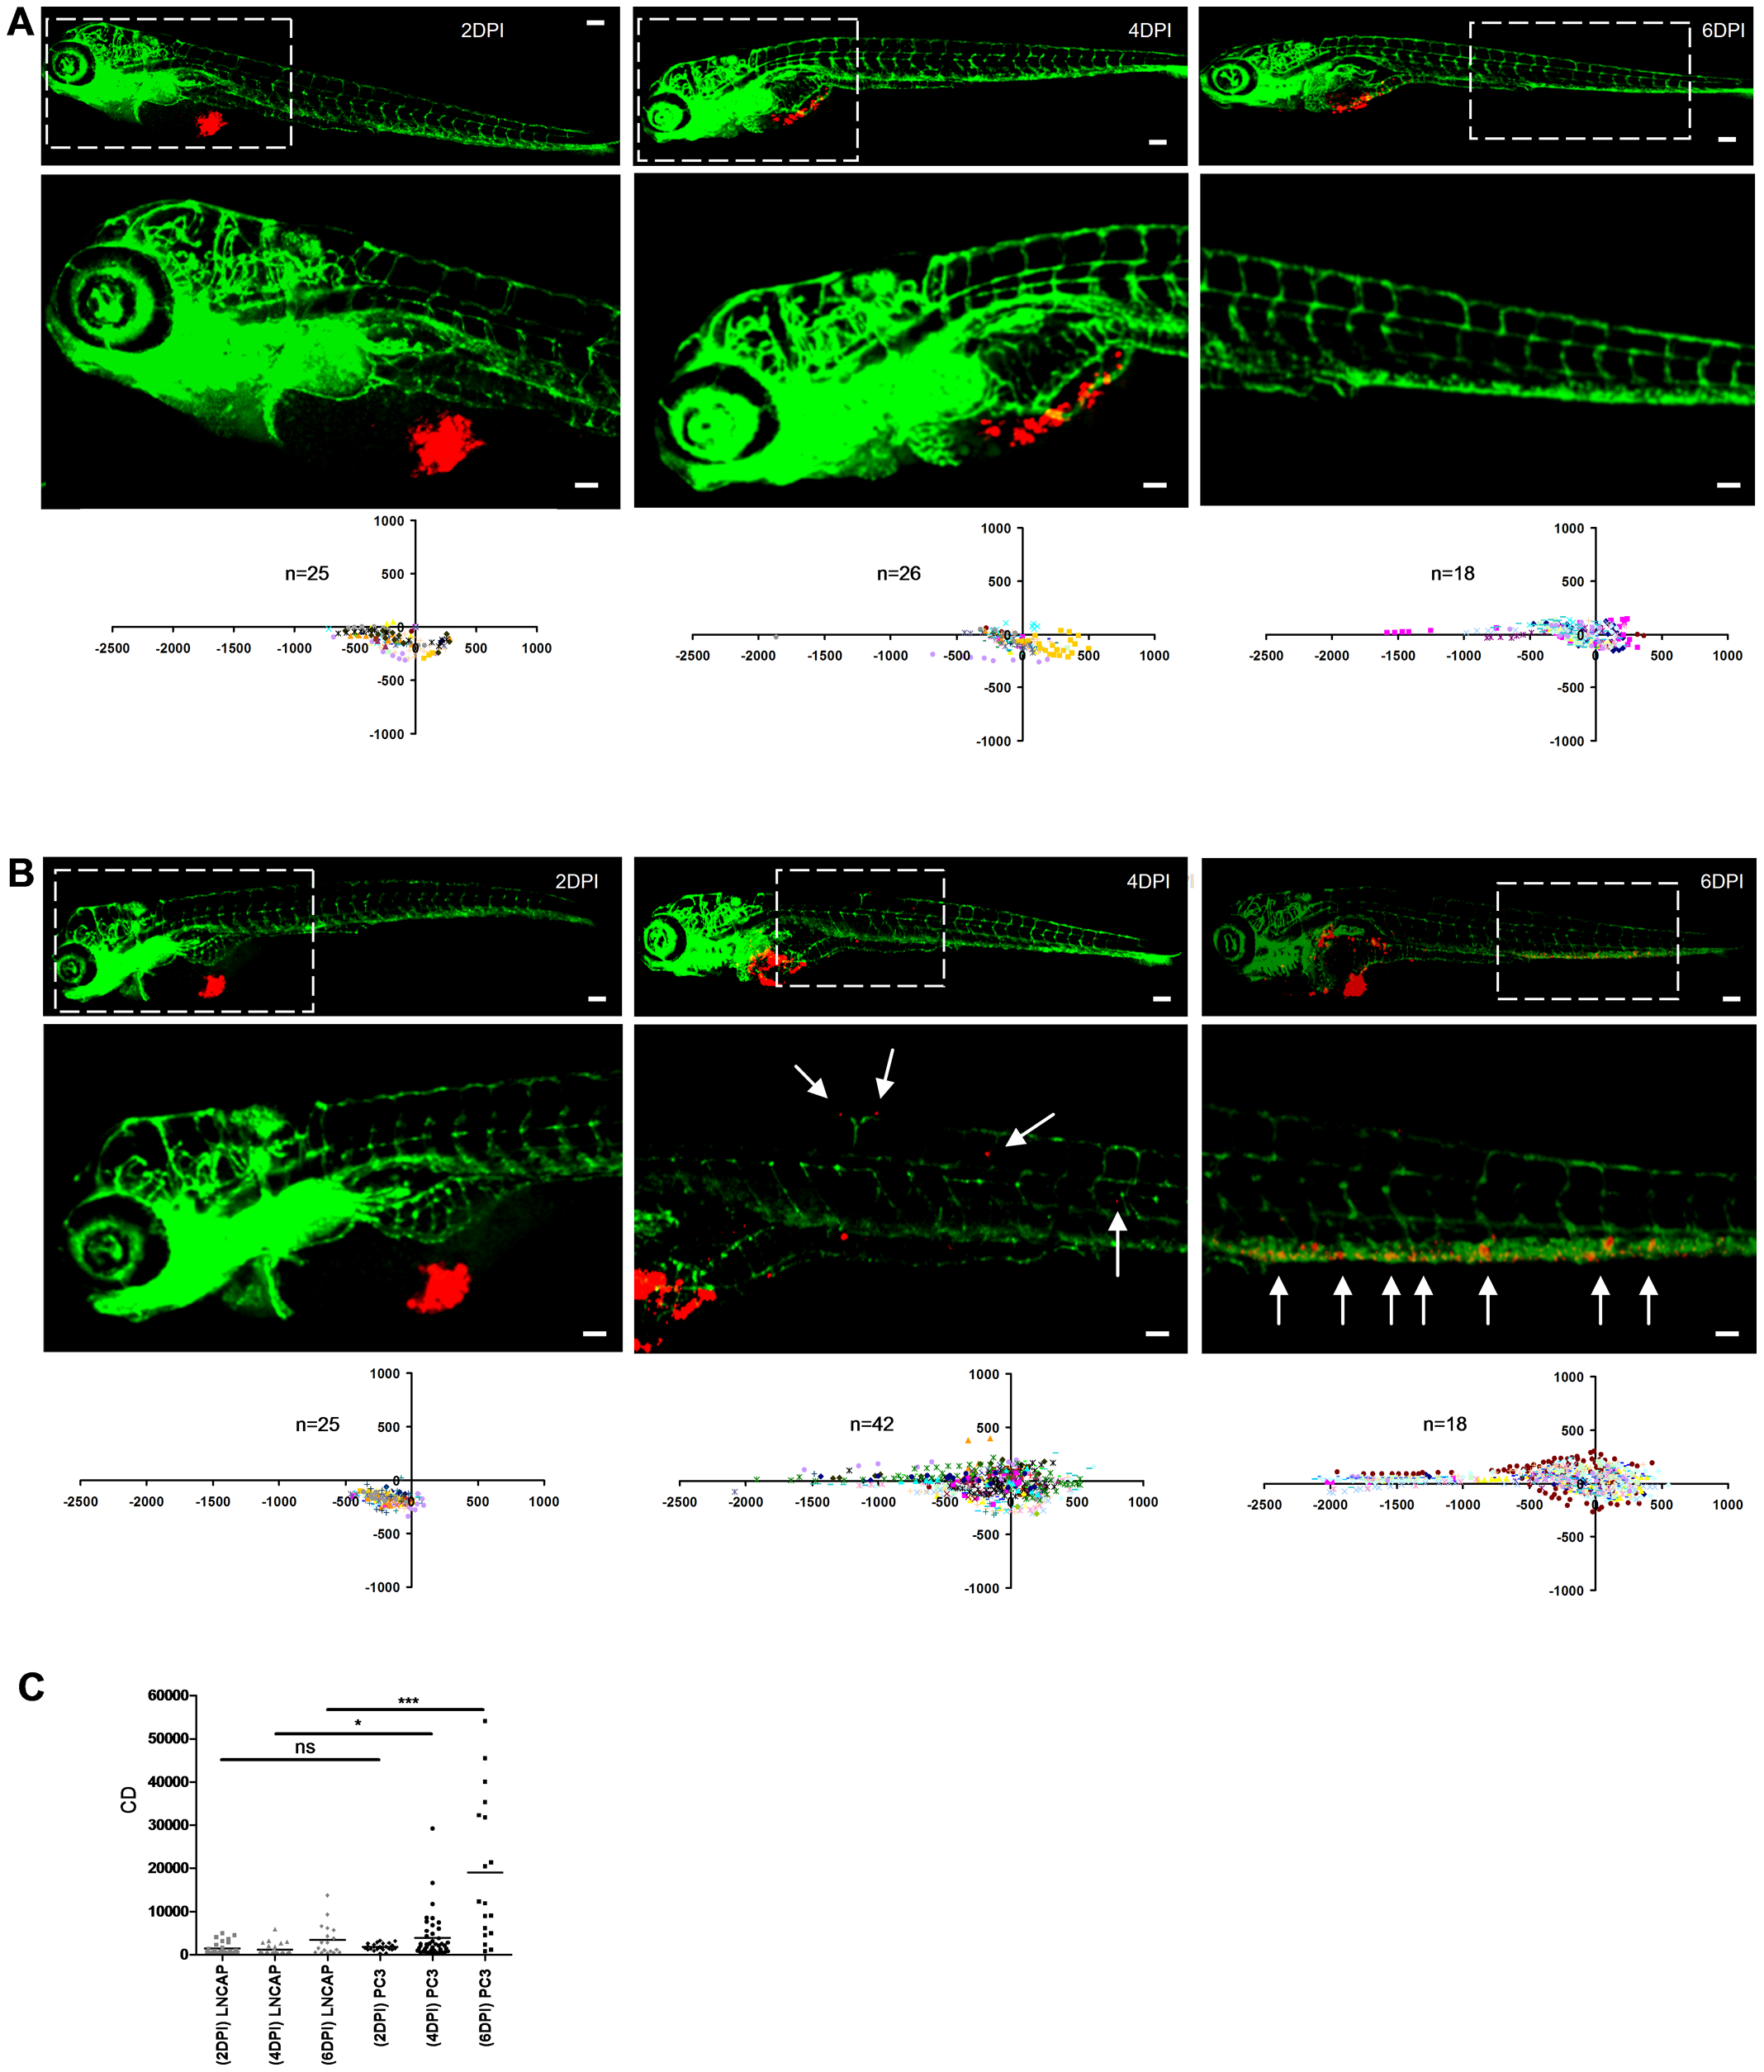
Fig. 4
Determination of cancer cell dissemination kinetics.
(A and B) LnCAP (A) or PC3 cells (B) were implanted and embryos were fixed at 2, 4, or 6 dpi for imaging (immunofluorescence images and automated image analysis (scatter plots)). Bottom row images (scale bar = 50 μm) show zoom-in of area marked by dotted line in top row images (scale bar = 100 μm). (C) CD at 2, 4 and 6 dpi for LnCAP (grey) and PC3-injected embryos (black) calculated from scatterplots in A and B, respectively. Statistical testing for difference between LnCAP and PC3 at different dpi is indicated. *p<0.05, ***p<0.001.
Acknowledgments
This image is the copyrighted work of the attributed author or publisher, and
ZFIN has permission only to display this image to its users.
Additional permissions should be obtained from the applicable author or publisher of the image.
Full text @ PLoS One