
|
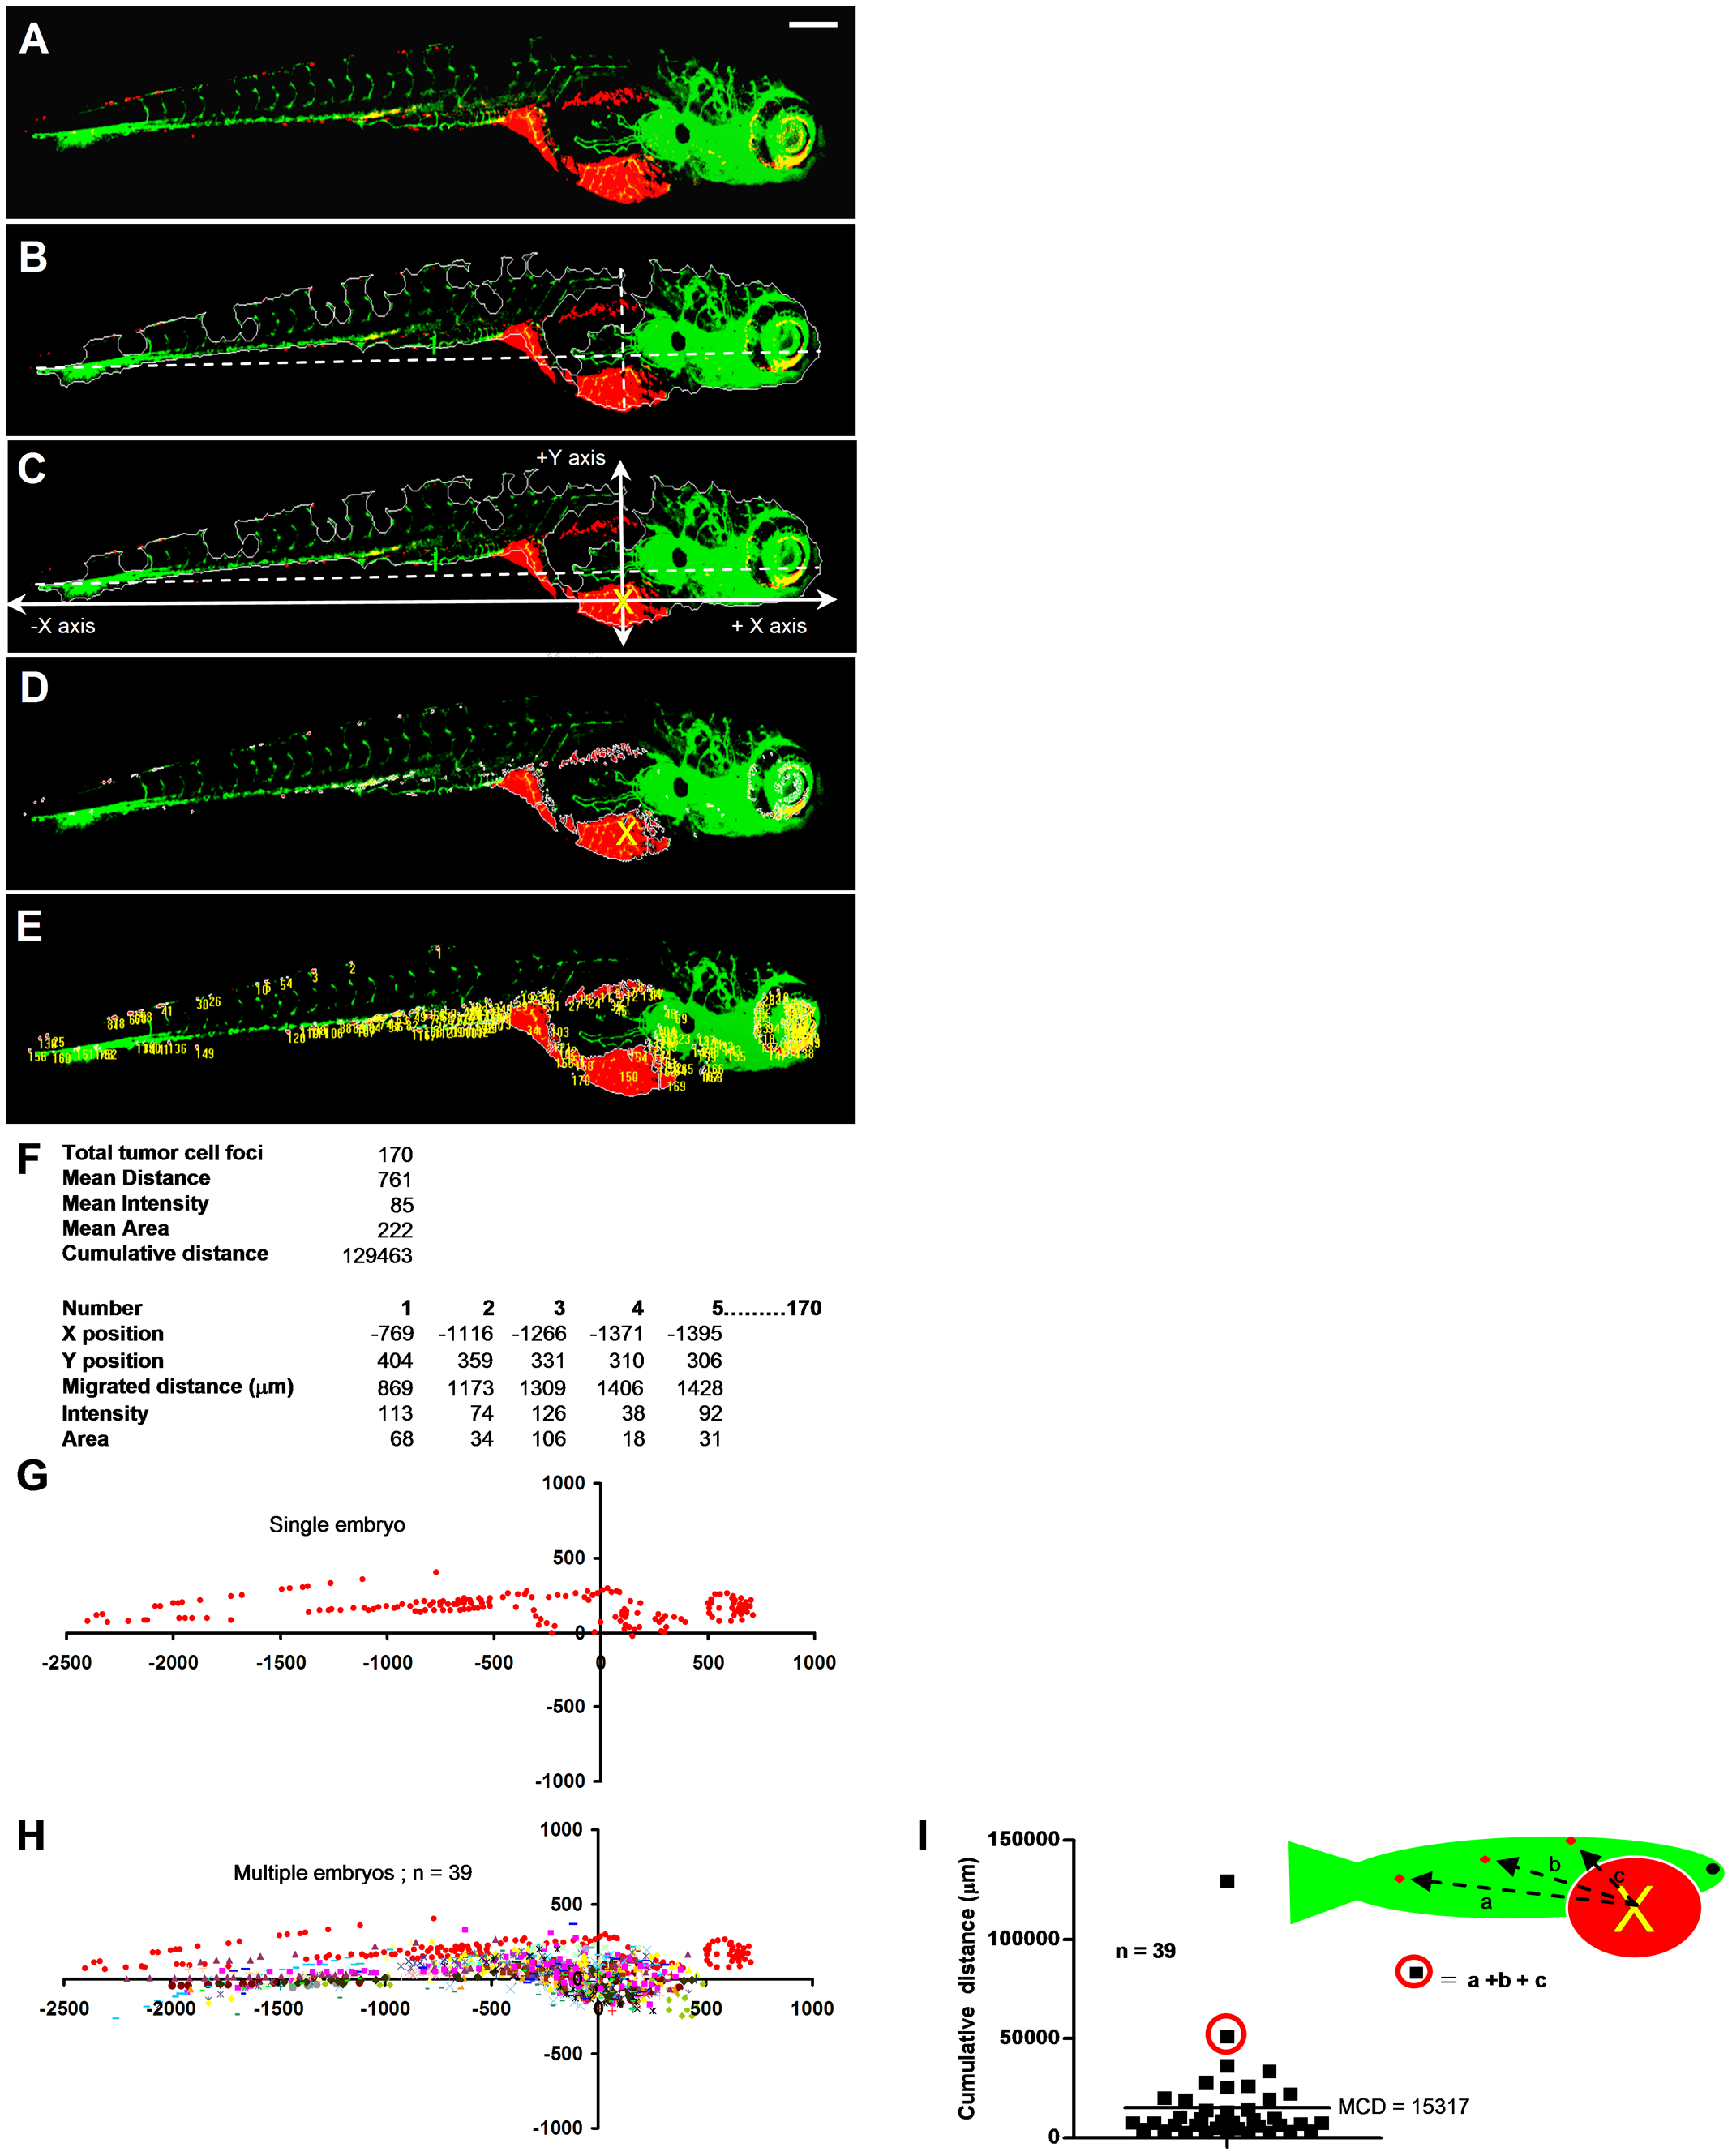
Fig. 3
Automated multiparametric quantification of PC3 tumor foci.
(A) Extended depth image of 6 dpi fixed embryo after realignment. (B) Embryo outline from segmented GFP channel and Y-axis intersecting X-axis at 75% from extreme left. (C) Calculated injection point at 75% distance from the extreme left and 75% from the top Y position. (D) Segmented red channel showing tumor foci burden in the embryo. (E) Identified tumor foci. (F) Multiple parameters of tumor foci burden calculated per embryo. Each number in the image corresponds to one tumor focus. (G) Tumor foci dissemination in a single embryo represented as scatter plot (coordinates 0,0 represents calculated injection site). (H) Combined scatter plot showing tumor foci dissemination from 39 injected embryos. (I) Quantification of cumulative distance (CD). Each filled square represents cumulative distance from injection point of all identified tumor foci in a single embryo. Mean cumulative distance (MCD) in the 39 injected embryos in this experiment is 15024 μm. Scale bar = 200 μm in A.