
|
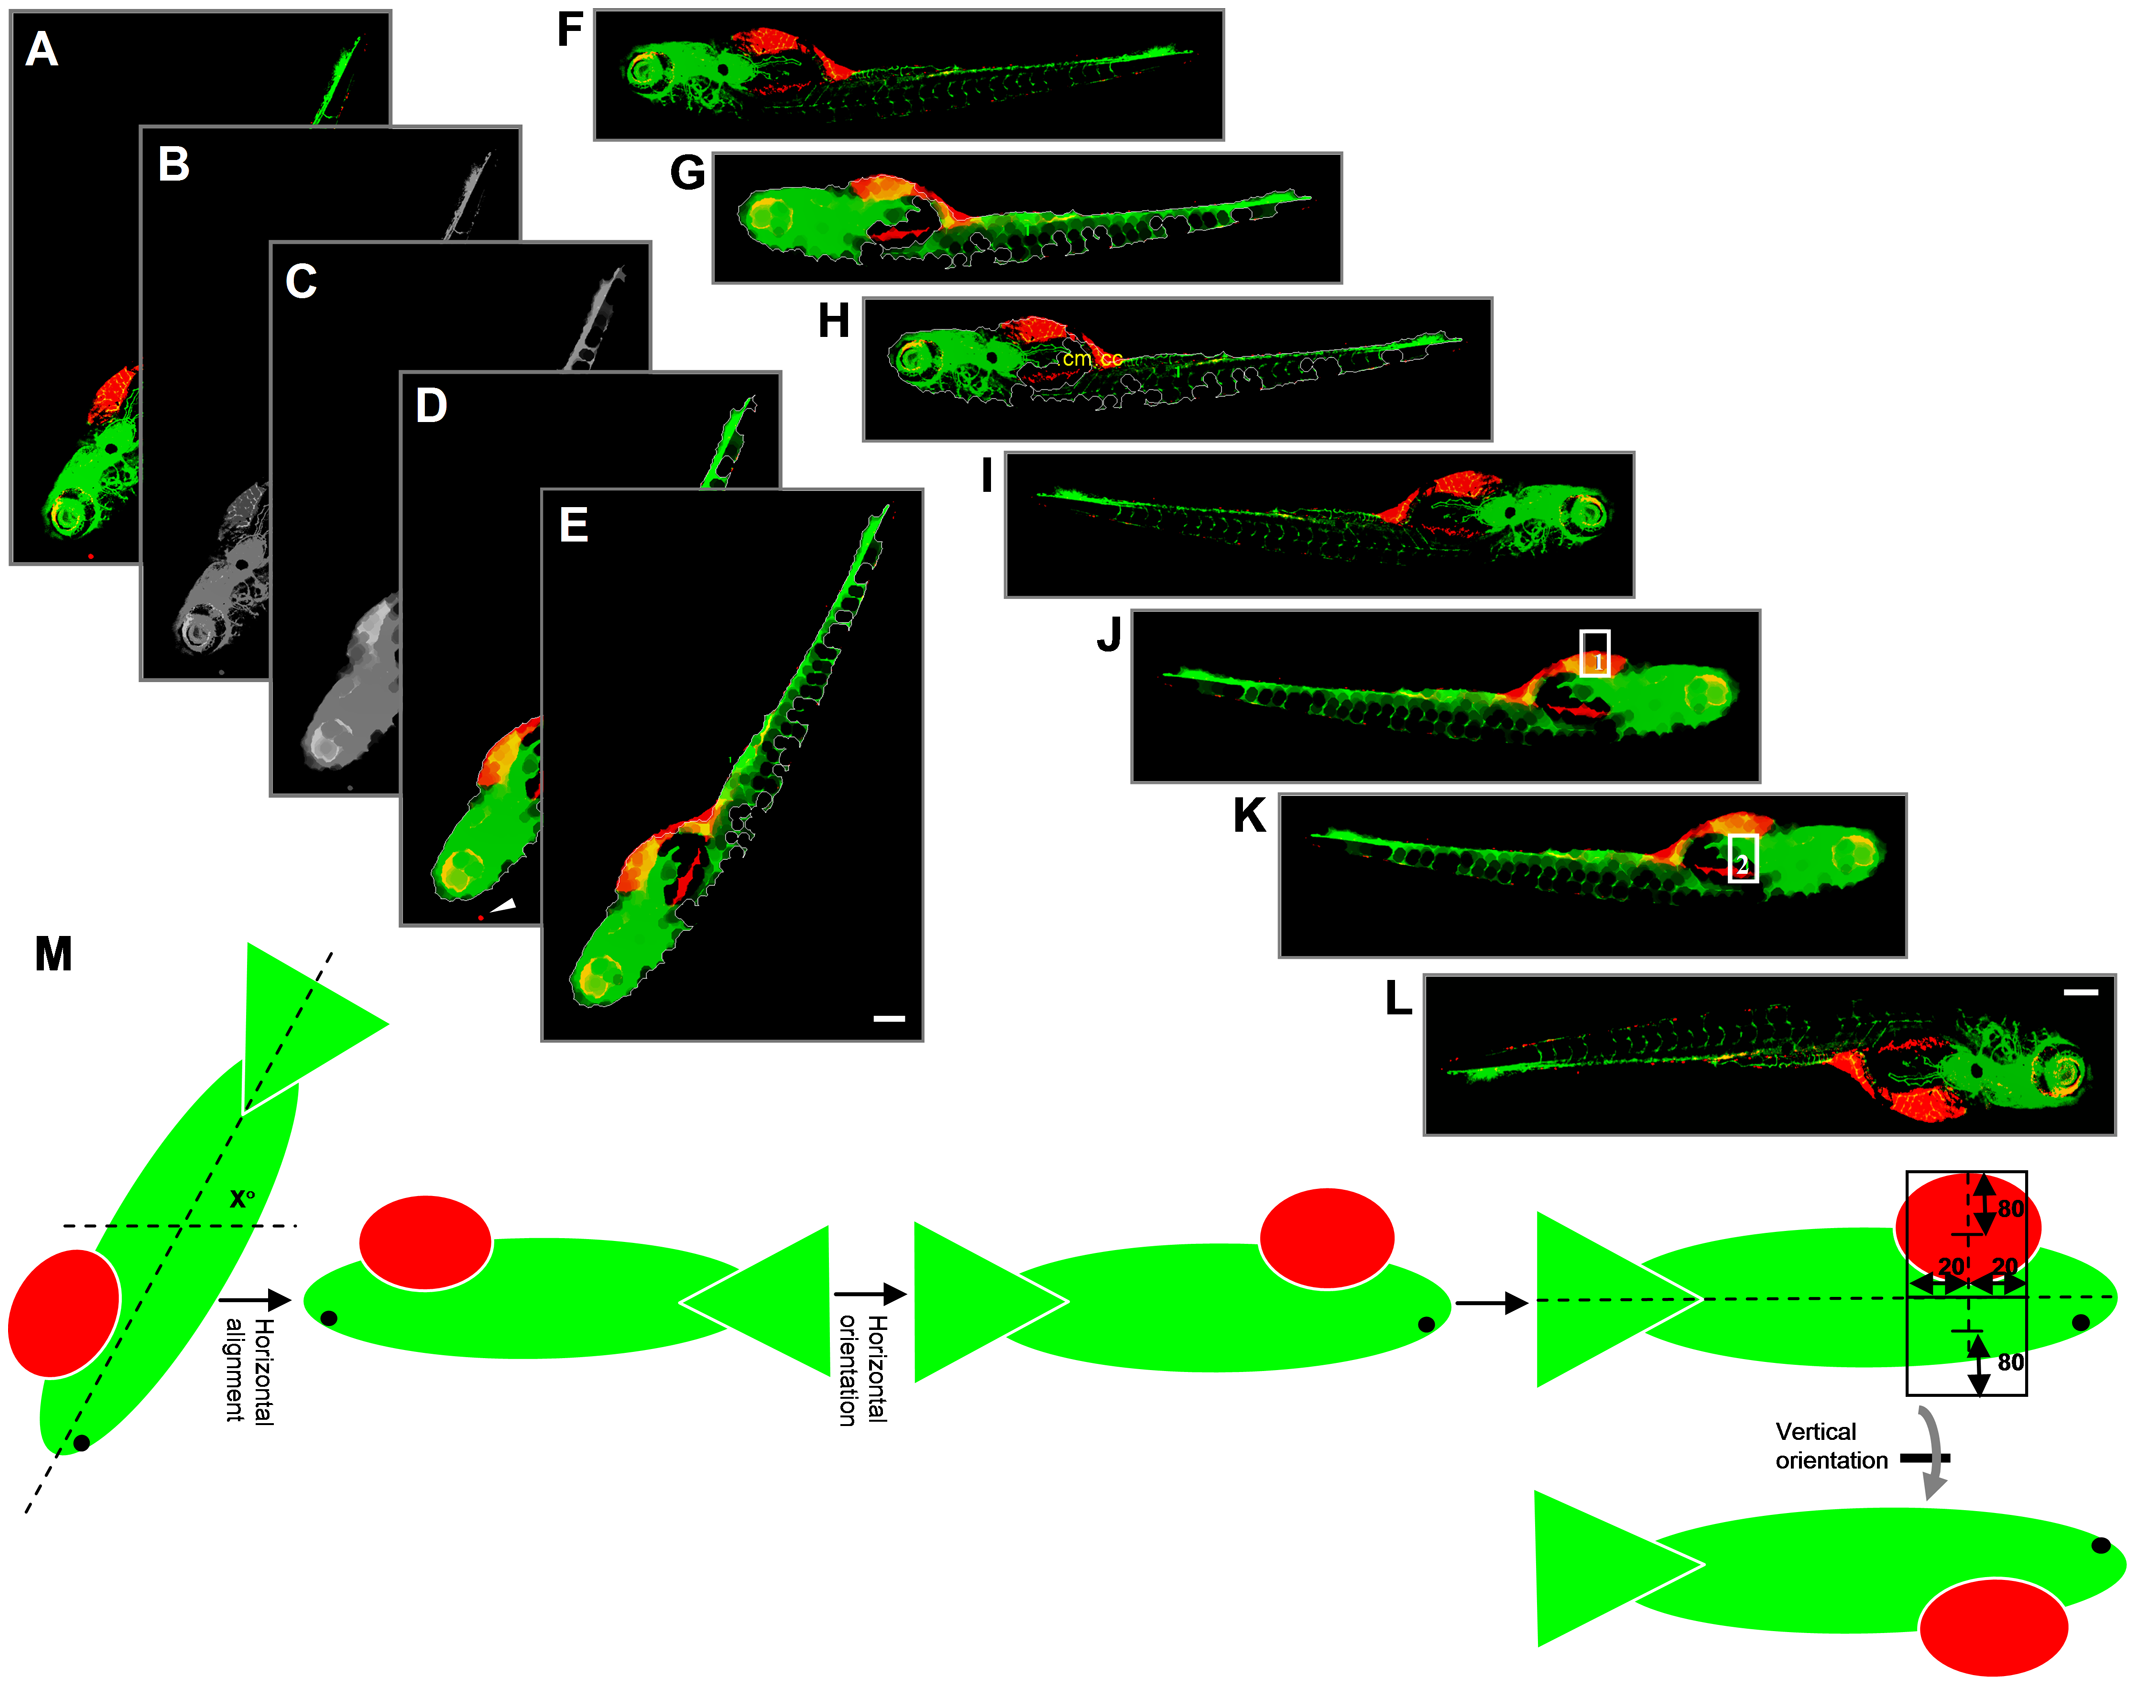
Fig. 2
Outline of steps involved in embryo orientation.
(A) Extended depth image of 6 dpi ZF embryo. (B) Grey value image from combination of green and red channels. (C) Blurred grey image after applying closing filter to optimize determination of outline. (D) Embryo segmented after applying intensity threshold and area filter. Arrowhead indicates a red object outside the outline that is excluded from segmentation. (E) Cropped image with only selected object. (F) Embryo rotated by x° for horizontal reorientation. (G and H) Determination of the x position value of the center of mass (cm) and center of centroid (cc). (I) Horizontal flip of the image only if cm is on the left side of cc, resulting in images with the head of the embryo always to the right side. (J) Image after applying closed filter to the combined green and red channel to get the outline of the embryo. Point lying at 75% distance from the extreme left of the embryo outline is calculated. Y-axis is drawn at this X-position from upper to lower outline. Upper rectangle 1 is drawn. (K) Lower rectangle 2 is drawn. (L) Vertical flip of the image only if red intensity in rectangle 1 is higher than in rectangle 2. (M) Schematic representation of calculations for steps E–I. Altogether, this procedure results in images where the head is on the right and the yolk sac is on the bottom of the image. Scale bar = 200 μm in E and I.