
|
Fig. 1
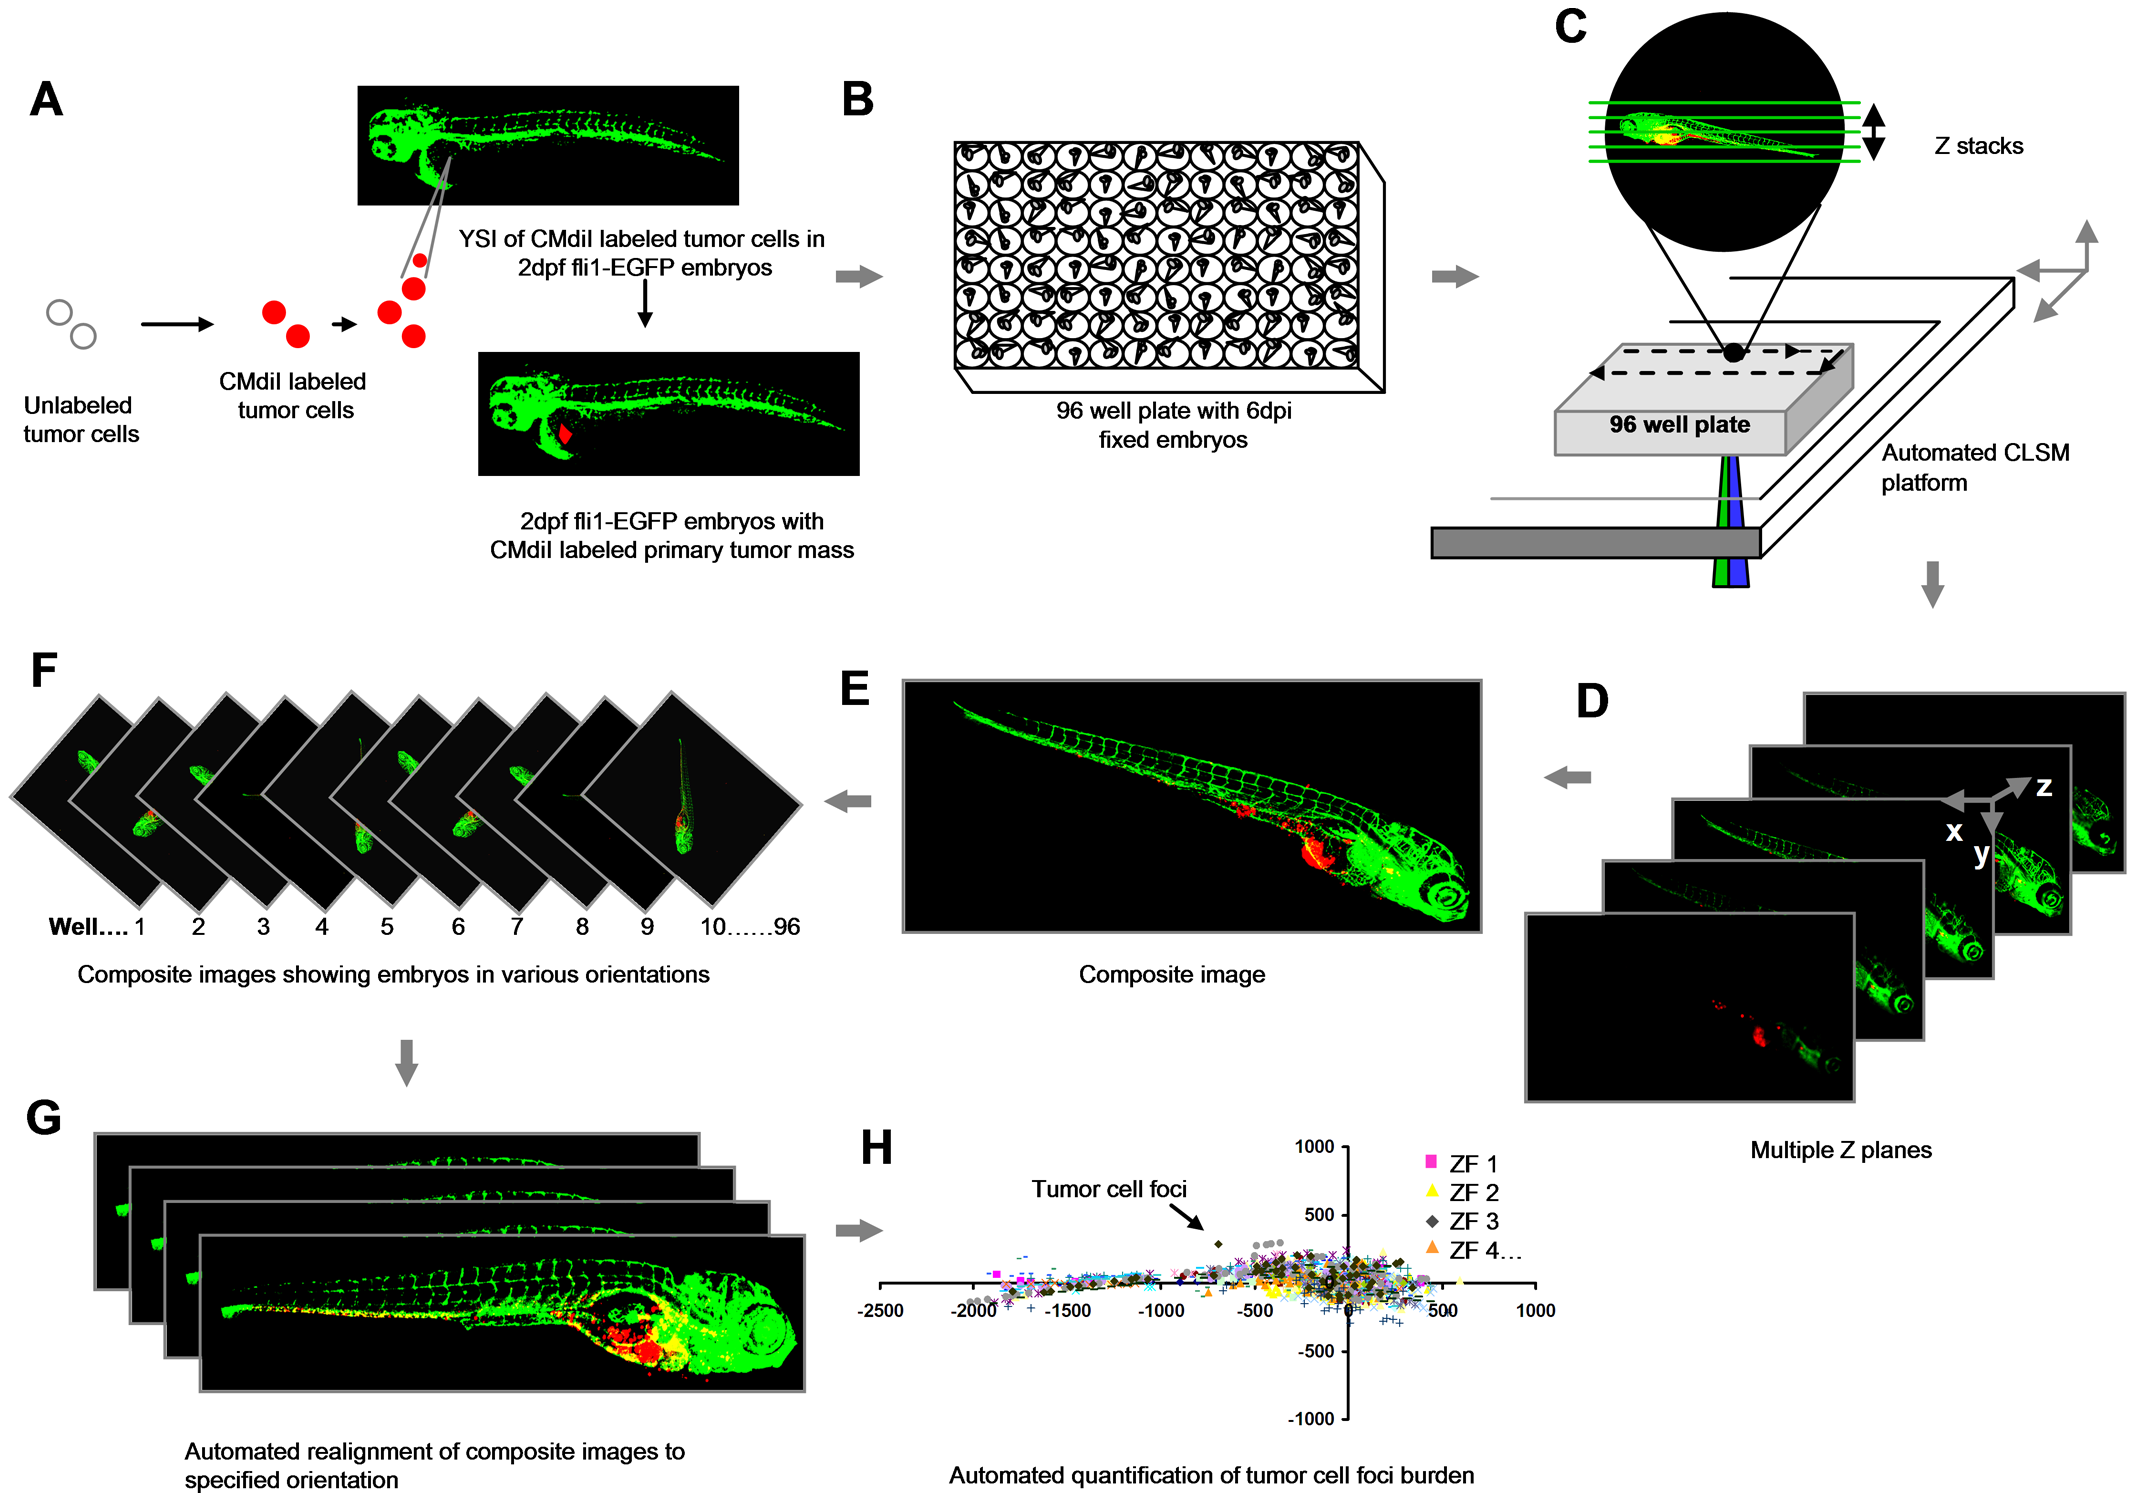
Schematic overview of the procedure.
(A) Yolk sac implantation of CM-DiI labeled tumor cells into Tg (Fli:EGFP) ZF embryos 2 days post-fertilization. (B) Formaldehyde fixed 6 dpi embryos arrayed in 96 well plates. (C) Automated image acquisition using CLSM platform equipped with movable stage captures multiple Z stacks per embryo using 488 and 561 nm laser lines. (D and E) Automated creation of extended depth composite images. (F) Multiple extended depth images depicting embryos lying in different lateral orientations. (G) Automated uniform reorientation of images. (H) Scatter plot representing tumor foci burden in multiple embryos belonging to one experimental condition.