
|
Fig. S6
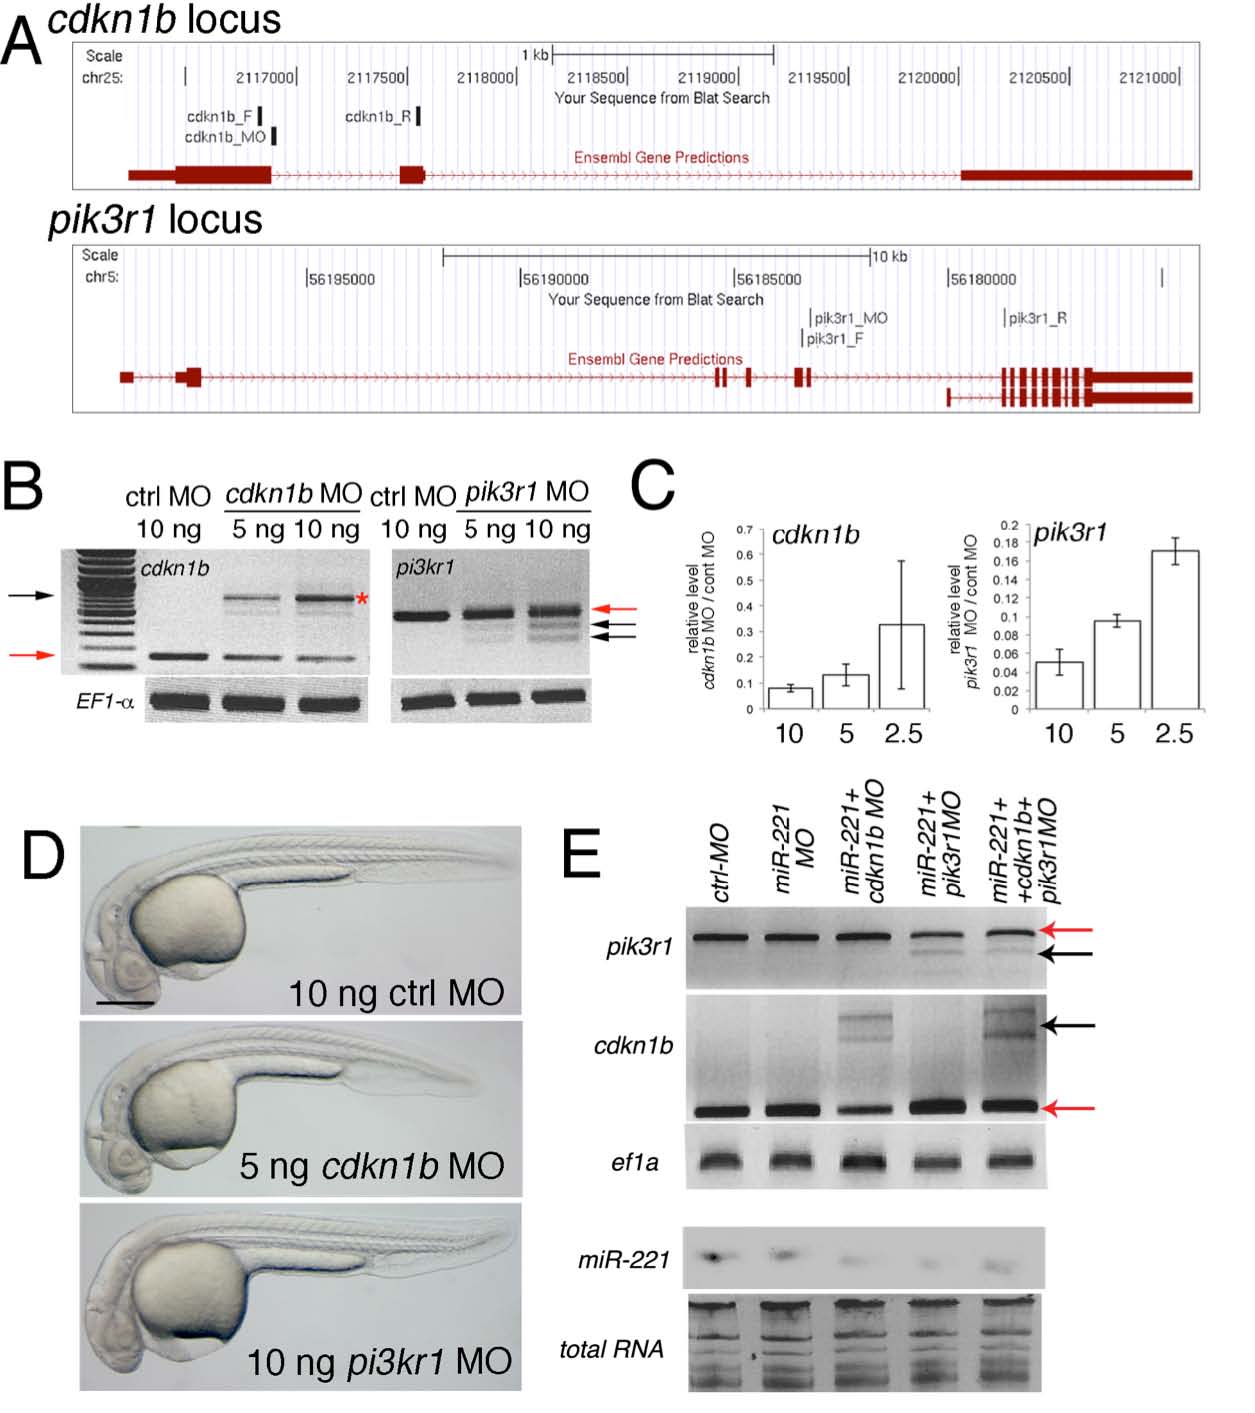
Morpholino-mediated knockdown of cdkn1b and pik3r1.
(A) cdkn1b and pik3r1 loci indicating position of splice-blocking MOs and PCR primers used in (B, E). Images were taken from the UCSC genome browser (Zv8).
(B) PCR amplification of cdkn1b or pik3r1 across exon junctions targeted by MOs indicated in (A). MO dose and target is indicated. ef1alpha is included as a control. Red arrows denote expected wild type fragment. Black arrows indicate mis-spliced products.
(C) qRT-PCR of cdkn1b and pik3r1 in MO-injected embryos. Levels are presented as a ratio of the level in cdkn1b or pik3r1 Morpholino-injected embryos (dose in ng on x-axis) over control MO injections.
(D) Transmitted light images of embryos at 27 hpf injected with 10 ng control MO, 5 ng of cdkn1b MO, or 10 ng of pik3r1 MO. Scale bar is 250 μm.
(E)Top, PCR of cdkn1b and pik3r1 in embryos injected with indicated MOs. Red arrow – wild type fragment. Black arrow – mis-spliced product. We observed comparable knockdown of cdkn1b and pik3r1 levels in single, double, and triple MO injections. Doses for single and double MO injection: 5 ng each of cdkn1b MO or pik3r1 MO and 10 ng of miR-221; triple injections: 10 ng of miR-221MO co-injected with 3 ng each of cdkn1b and pik3r1 MOs. All MOs were co-injected with 1ng tp53 MO. Bottom panels, Northern analysis of miR-221 levels following MO injections. Total RNA is loading control.
Reprinted from Developmental Cell, 22(2), Nicoli, S., Knyphausen, C.P., Zhu, L.J., Lakshmanan, A., and Lawson, N.D., miR-221 Is Required for Endothelial Tip Cell Behaviors during Vascular Development, 418-429, Copyright (2012) with permission from Elsevier. Full text @ Dev. Cell