
|
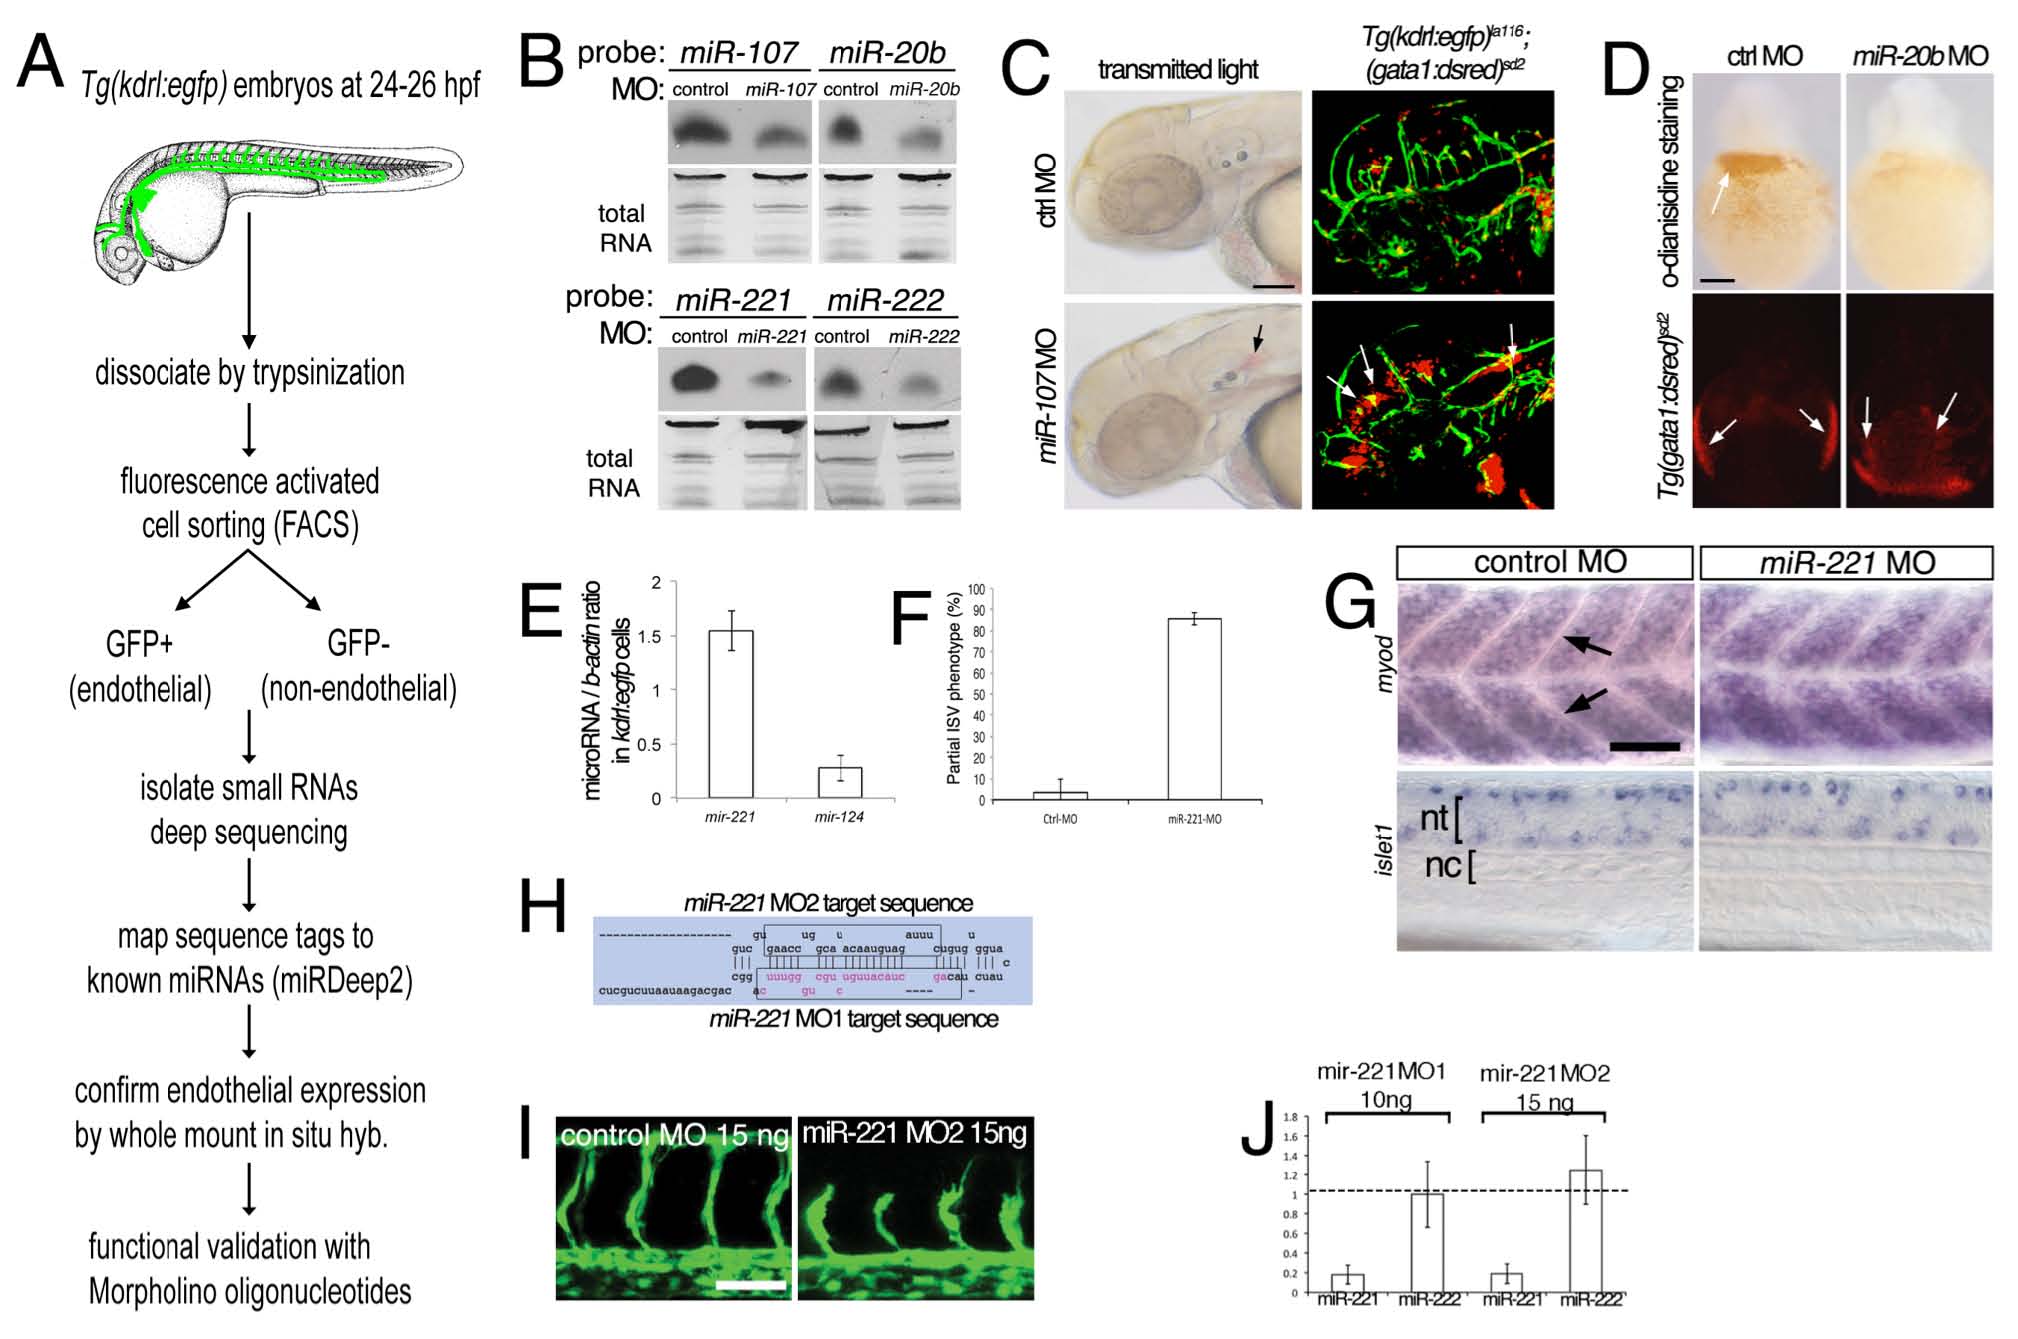
Fig. S1
A screen for endothelial-expressed small RNAs in zebrafish identifies miR-221 as a proangiogenic microRNA.
(A) Overview of screening strategy to identify endothelial-expressed microRNAs.
(B) Northern analysis of microRNA expression in embryos injected with control Morpholino (MO) or MO targetting indicated microRNA. MO doses: 7 ng miR-107 MO, 14 ng miR-20b MO, 10 ng miR-221 MO, 20 ng miR-222 MO. microRNAs were detected using DIG-LNA probe. Total RNA served as loading control.
(C) Left, transmitted light images of embryos injected with 7 ng control or miR-107 Morpholino showing evidence of cranial hemorrhage (indicated by black arrow). Right, leakage of gata1-positive cells from the vessels (denoted by white arrows) in Tg(kdrl:egfp)la116; (gata1:dsred)sd2 injected with miR-107 MO further indicating cranial hemorrhage. Scale bar is 100 μm
(D) Top, o-dianisidine staining of hemoglobinized red blood cells in embryos injected with 14 ng control or miR-20b MO. Bottom, Tg(gata1:dsred)sd2 embryos injected with 14 ng control or miR-20b Morpholino. gata1: dsred-positive cells are present in both suggesting that miR-20b is required for terminal differentiation of erythroid cells. Scale bar is 100 μm.
(E) qPCR analysis of miR-221 and miR-124 in GFP+ cells isolated from Tg(kdrl:egfp)la116 embryos by FACS at 24 hpf. microRNA expression levels in relation to bactin levels.
(F) Percentage of embryos with partial ISV sprouts at 27 hpf after injection with 10 ng of control and miR- 221 MO. p-value < 0.0001, 90 embryos from 3 separate injection.
(G) myod (top) and islet1 (bottom) expression in somites (arrowheads) and neural tube at 28 hpf. Left, embryos injected with 10 ng control MO. Right, embryos injected with 10 ng miR-221 MO. Differential interference contrast imaging, lateral views, dorsal is up, anterior to the left. Scale bar is 50 μm. nc – notochord, nt – neural tube.
(H) Schematic of the miR-221 hairpin indicating position of MOs used for inhibiting maturation.
(I) Confocal micrographs of Tg(kdrl:egfp)la116 embryos at 27 hpf injected with a control morpholino or a second morpholino (MO2) targeting miR-221. Scale bar is 50 μm.
(J) qPCR analysis of mature miR-221 and miR-222 levels in embryos injected with either miR-221 MO. Levels are relative to embryos injected with 10 ng control MO.
Reprinted from Developmental Cell, 22(2), Nicoli, S., Knyphausen, C.P., Zhu, L.J., Lakshmanan, A., and Lawson, N.D., miR-221 Is Required for Endothelial Tip Cell Behaviors during Vascular Development, 418-429, Copyright (2012) with permission from Elsevier. Full text @ Dev. Cell