
|
Fig. 6
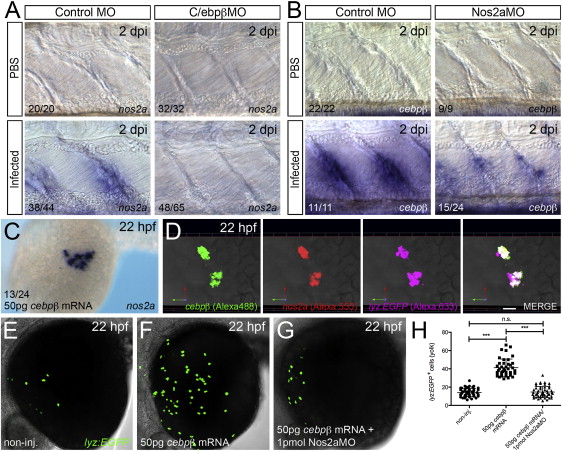
Nos2a Functions Downstream of C/ebpβ during Demand-Driven Granulopoiesis (A) Expression of nos2a within the AGM of control MO- and C/ebpβ MO-injected larvae following infection, compared with PBS controls at 2 dpi. (B) Expression of cebpβ within the AGM of control MO- and Nos2a MO-injected larvae following infection, compared with PBS controls at 2 dpi. (C) Expression of nos2a at 22 hpf, following injection of 50 pg cebpβ mRNA. (D) Dual WMISH of cebpβ and nos2a and immunofluorescence detection of lyz:EGFP within a Tg(lyz:EGFP) embryo at 22 hpf, following injection of 50 pg cebpβ mRNA. (E-G) lyz:EGFP-expressing myeloid progenitors on the yolk of noninjected, cebpβ mRNA-injected, and cebpβ mRNA/Nos2a MO-injected Tg(lyz:EGFP) embryos at 22 hpf, respectively. (H) Quantification of lyz:EGFP-expressing cells on the yolk of embryos in (E)-(G). Numbers represent frequency of embryos or larvae with displayed phenotype. All views, anterior to left. Scale bar, 10 μm in (D). Abbreviations: n.s., not significant; ***p < 0.001. See also Figure S6.