
Fig. 1
|
Fig. 1
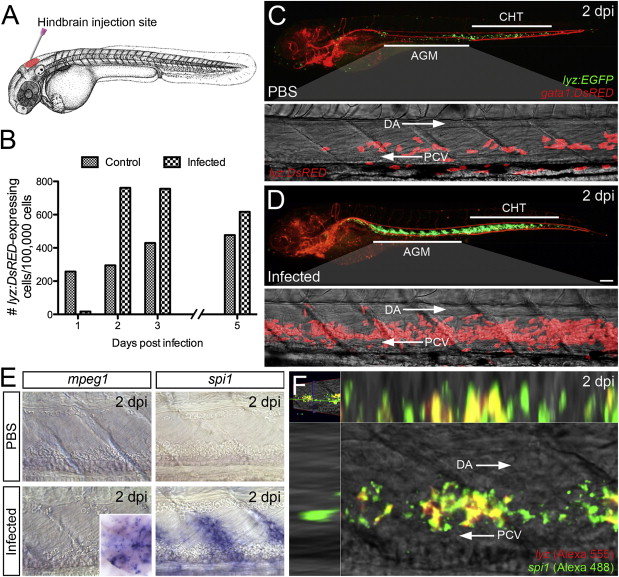
Larval Hematopoietic Response to Infection (A) Schematic illustrating hindbrain injection site of live GFP-labeled Salmonella. (B) Quantities of whole-larvae lyz:DsRED-expressing cells (per 100,000 sorted cells), as determined by flow cytometry, within infected Tg(lyz:DsRED) larvae (600 cfu) at 1, 2, 3, and 5 dpi, compared with PBS controls (n = 50 larvae/sample). (C and D) Enhanced granulopoiesis within the AGM and CHT of infected (600 cfu) Tg(lyz:EGFP)/Tg(gata1:DsRED) larvae at 2 dpi, relative to PBS controls (with magnified views of AGM region within similarly treated Tg(lyz:DsRED) larvae). (B)–(D) refer only to those infected larvae that displayed neutrophil depletion at 1 dpi (see Supplemental Experimental Procedures). (E) Expression of mpeg1 and spi1 within the AGM at 2 dpi following infection, compared with PBS controls. Inset demonstrates mpeg1-expressing cells within the midbrain and hindbrain. (F) Dual WMISH of lyz and spi1 expression within the AGM following infection at 2 dpi. All views, anterior to left. Scale bar, 100 μm in (D). Abbreviations: AGM, aorta-gonad-mesonephros; CHT, caudal hematopoietic tissue; DA, dorsal aorta; PCV, posterior cardinal vein. See also Figure S1.