
|
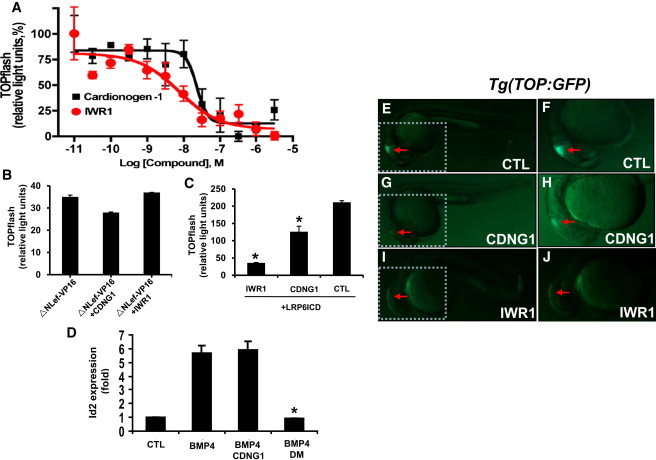
Fig. 6 Cardionogen Inhibits Wnt3a/β-Catenin-Mediated Transcription (A) Cardionogen-1 inhibits Wnt3a-induced TOPflash activity in ES cells. CGR8-ES cells were treated with Wnt3a (100 ng/ml)-conditioned media plus CDNG1 or IWR1 compounds in a series of concentrations. Dose-response curves represent TOPflash activities normalized to cell number (mean ± s.d.; performed in quadruplicate). The calculated EC50 values for Cardionogen-1 and IWR1 are 23 nM and 7.5 nM, respectively. Graphs were made in Prism 4 (GraphPad Software) with nonlinear regression fit to a sigmoidal dose-response curve. (B) Cardionogen does not inhibit Lef/Tcf transcription that is independent of β-catenin activity. CGR8-ES cells were transfected with ΔNLef-VP16 and treated with 1 μM Cardionogen-1 or 1 μM IWR1. Graph represents TOPflash activities (mean ± s.d.; performed in triplicate). (C) Cardionogen inhibits LRP6-mediated Wnt signaling. CGR8-ES cells were transfected with a constitutively active LRP6ICD and treated with 1 μM Cardionogen-1, 1 μM IWR1, or 0.1% DMSO (CTL). TOPflash activity is graphed (mean ± s.d; performed in triplicate; *p < 0.01). (D) Bar chart showing relative expression fold of BMP4-induced Id2 expression ([Hua et al., 2006] and [Nakahiro et al., 2010]) in the presence of CDNG1, BMP4, BMP4+CDNG1, BMP4+DM, compared to its expression in 0.1% DMSO (CTL). Concentrations were 30 ng/ml for Bmp4, 1 μM for CDNG1, and 1 μM for DM. Id2 expression normalized to GAPDH is graphed (mean ± s.d; performed in triplicate; *p < 0.01). CTL values were arbitrarily set to 1. (E–J) Images taken at 24 hpf (see also Figures S2 and S3). Red arrows indicate GFP expression. (E and F) Fluorescent optics revealing GFP fluorescence in the midbrain in Tg(TOP:GFP) embryos [outlined area enlarged in (F)]. (G and H) CDNG1 treatment (30 μM; 5–24 hpf) reduces GFP fluorescence in the midbrain of Tg(TOP:GFP) embryos [outlined area enlarged in (H)]. (I and J) IWR1 treatment (30 µM; 5–24 hpf) eliminates GFP fluorescence in the midbrain of Tg(TOP:GFP) embryos [outlined area enlarged in (J)].