
|
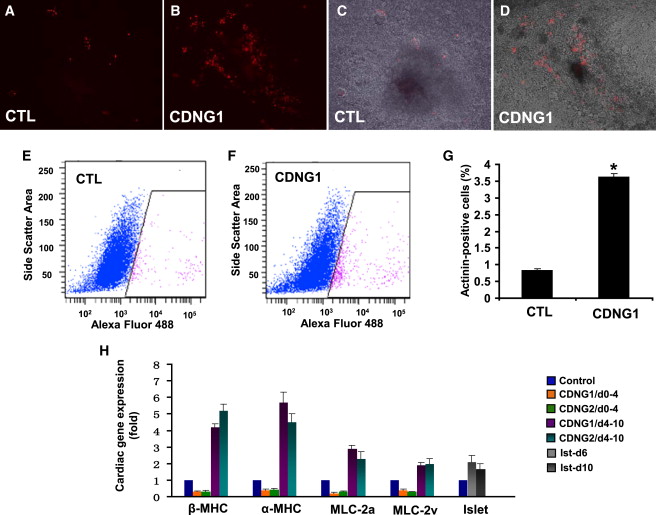
Fig. 5
Cardionogen Induces Murine ES Cells to Differentiate into Cardiomyocytes (A and B) Fluorescent optics revealing myocardial differentiation (red areas) in 0.1% DMSO-treated (CTL) and 1 μM CDNG1-treated CGR8-ES cells (Tg[αMHC:DsRed-nuc]). (C and D) Bright-field pictures merged with fluorescent images of control (A) and CDNG1-treated cells (B). (E and F) Flow-cytometry analyses revealing the fraction of ES cells expressing αMHC:DsRed-nuc in 0.1% DMSO-treated and CDNG1-treated ES cells. The x axis is the intensity of Alexa Fluor 488 immunostaining; the y axis is the side scatter area. (G) Analysis of sarcomeric α-actinin by flow cytometry indicates that CDNG1 treatment enhances cardiomyocyte content 4.36-fold (from 0.83 ± 0.06% to 3.62 ± 0.09%). GCR8-ES cells were treated with 0.1% DMSO and 1 μM CDNG1 from day 4 to day 10 and analyzed at day 12. (H) Bar chart depicting relative expression folds of βMHC, αMHC, MLC-2a, MLC-2v, and islet in 1 μM CDNG1- and CDNG2-treated ES cells, compared to 0.1% DMSO-treated controls. βMHC, αMHC, MLC-2a, and MLC-2v were examined at day 12; islet was examined at days 6 and 10. GAPDH was used as internal controls for normalization. CTL values were arbitrarily set to 1. Graphs (G and H) show mean ± s.d., performed in triplicate; *p < 0.01 compared with control. See also Movies S1 and S2.