
|
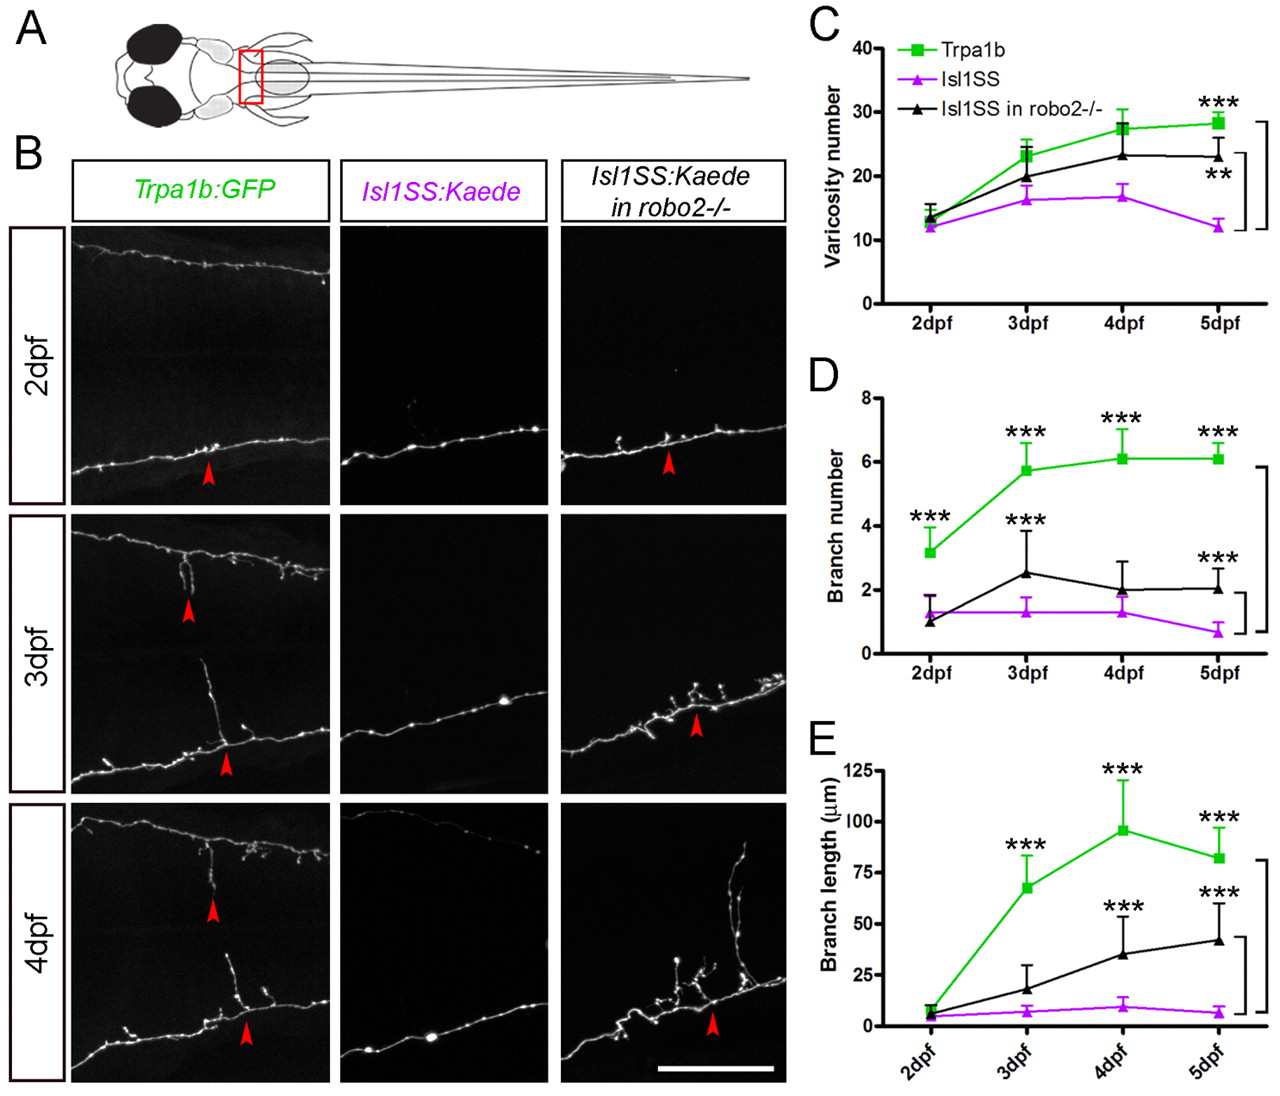
Fig. 7 Morphogenesis of subtype-specific branch growth and synaptogenesis. (A) Multi-time point imaging was performed in segments 9-11 (boxed area), where the innervation pattern differs most between Trpa1b and Isl1SS neurons. (B) Fluorescent images of individual trigeminal sensory neuron afferents imaged from 2 to 4 dpf. Representative examples are shown for Trpa1b (left column), Isl1SS (middle) and Isl1SS in robo2-/- (right) zebrafish. Red arrowheads point to branches. (C-E) Afferent morphology is compared between genotypes (wild type versus robo2-/- in the Isl1SS subtype) and subtypes (Trpa1b versus Isl1SS). Error bars indicate s.e.m. **, P<0.01; ***, P<0.001. Scale bar: 50 μm.