
|
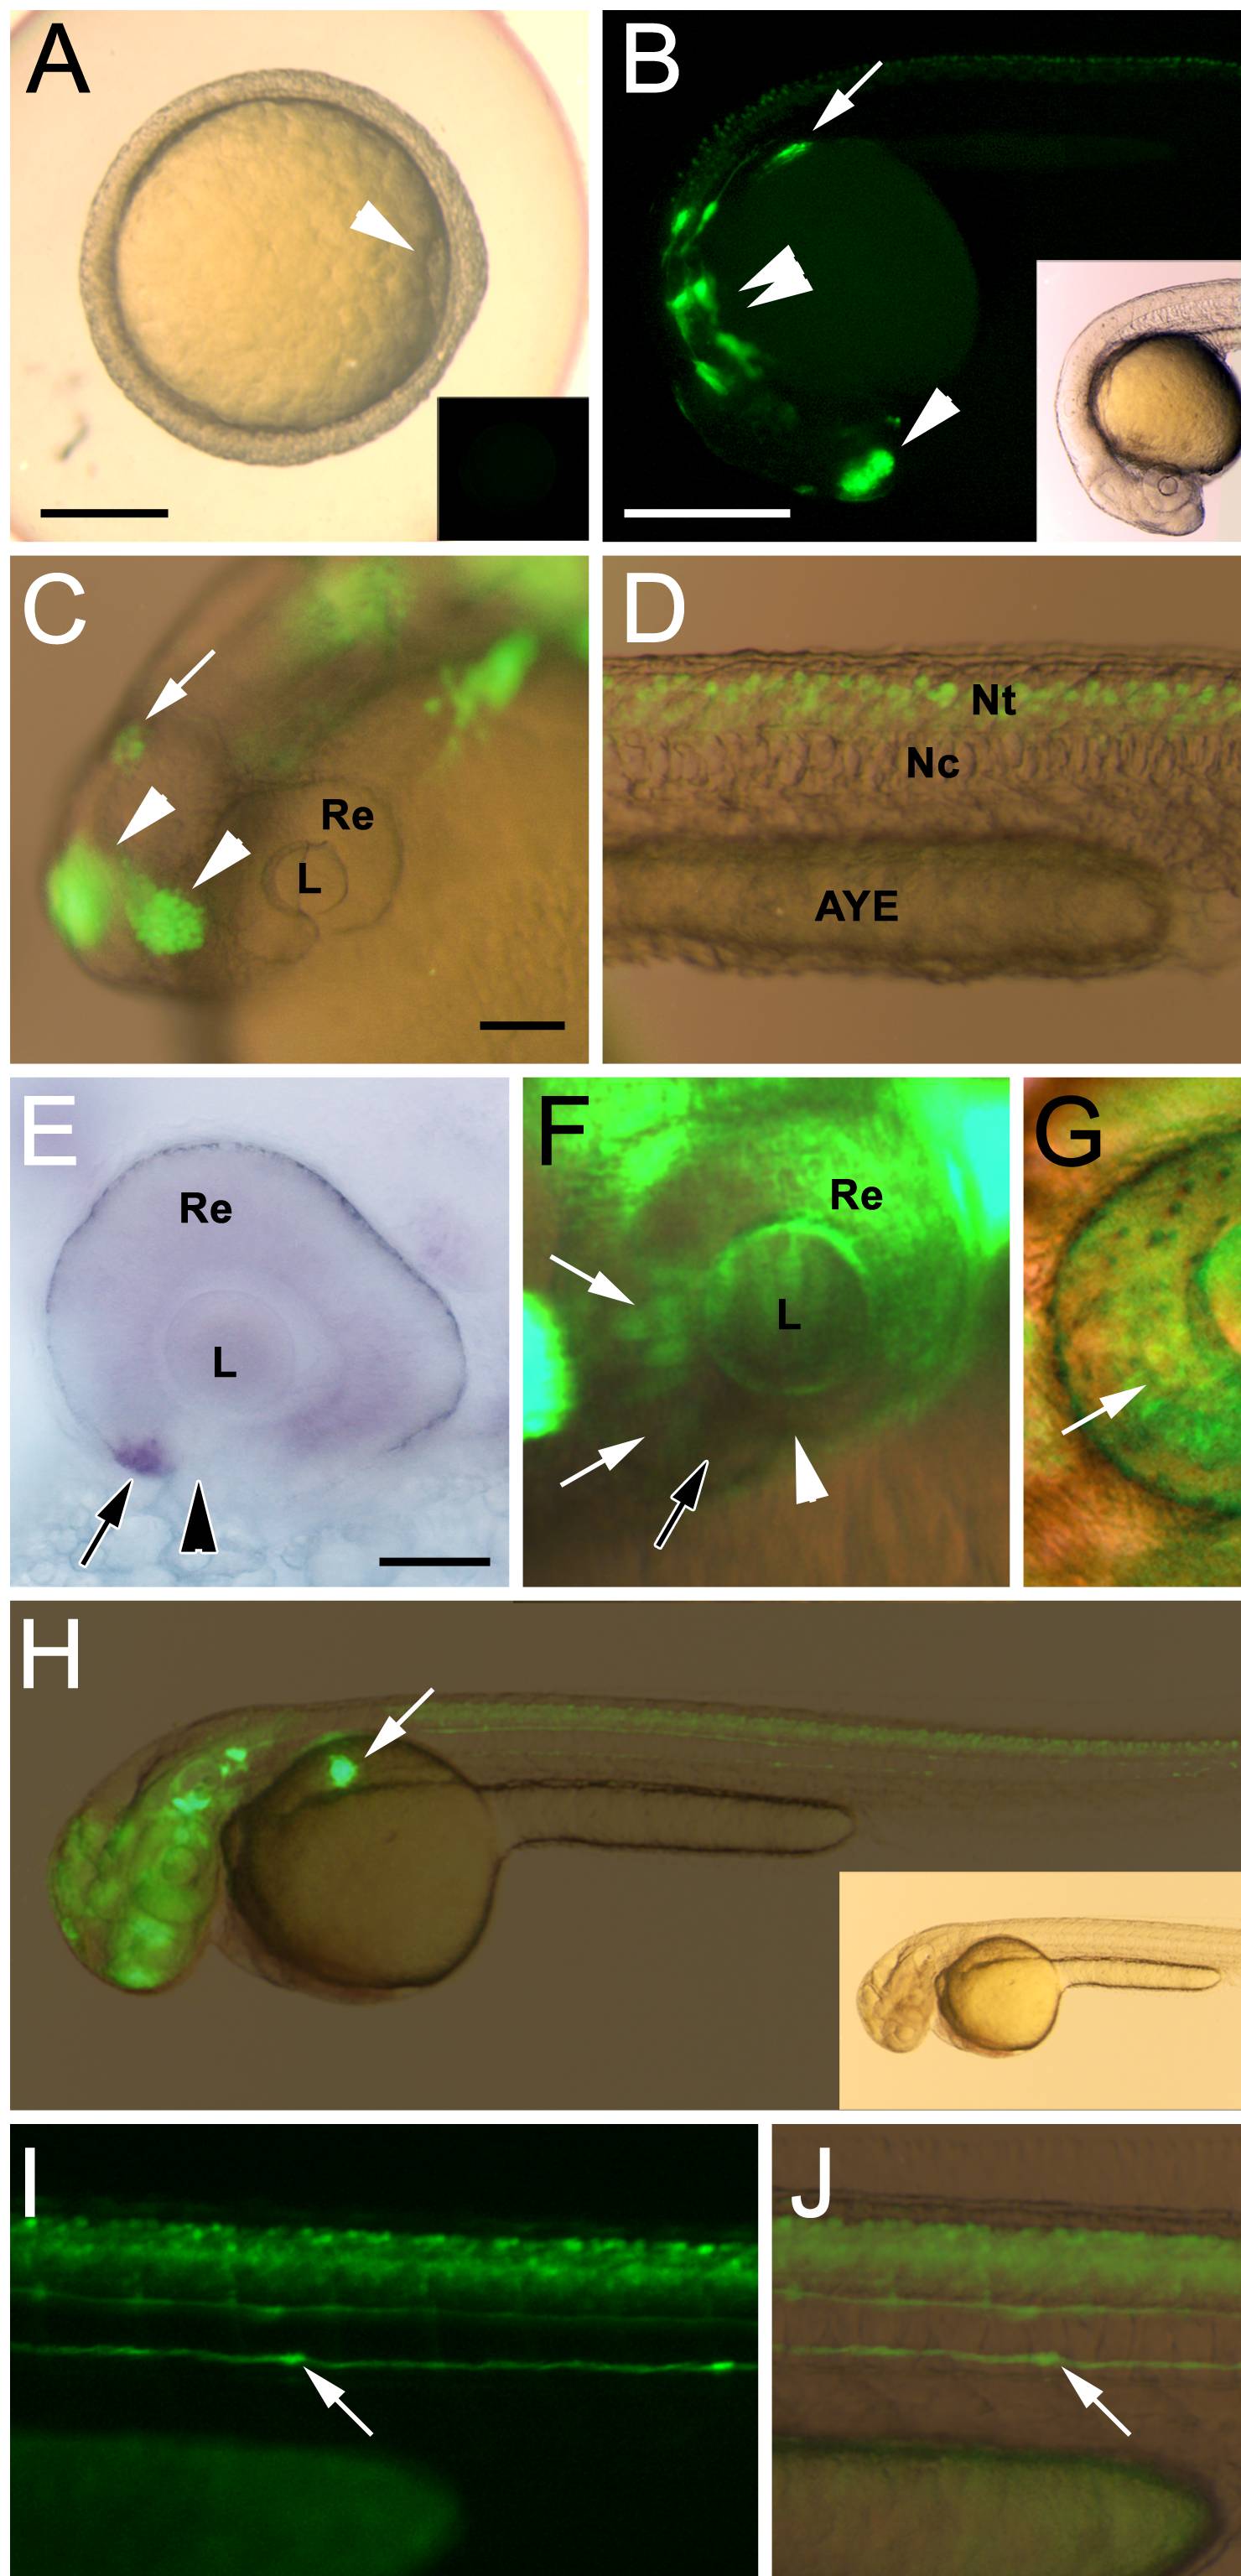
Fig. 1 Wholemount brightfield and flourescent images showing nrd:egfp transgene expression in the developing Tg(nrd:egfp)/albino zebrafish.
(A) Brightfield image with fluorescent inset showing the absence of transgene expression at 6 hpf. Arrowhead notes the gastrulation site (B) Fluorescent image with a brightfield inset at 24 hpf showing EGFP expression in the developing pancreas (arrow), olfactory bulbs (single arrowhead), and regions of the midbrain and hindbrain (double arrowheads). (C) High magnification overlay of brightfield and fluorescent images at 24 hpf. EGFP is detected in the olfactory bulbs (arrowheads), pineal gland (arrow), and inner ear (top right of panel). At this time it is not observed in the developing eye. (D) High magnification overlay of brightfield and fluorescent images at 24 hpf showing EGFP expression in the neural tube. (E) RNA in situ hybridization at 31 hpf, showing endogenous neurod expression in the ventral nasal patch (arrow), immediately adjacent to the choroid fissure (arrowhead). (F) Fluorescent image showing EGFP-positive cells in the retina at 32 hpf that are within a region (white arrows) immediately adjacent to the ventral nasal patch (black arrow). The choroid fissure is marked with a white arrowhead). (G) High magnification overlay of brightfield and fluorescent images at 48 hpf showing EGFP expression in throughout the inner retina (arrows) and in the outer retina (arrowhead). (H) Overlay of brightfield and fluorescent at 48 hpf (with brightfield image inset), showing EGFP in the developing pancreas. (I–J) Fluorescent (I) and brightfield overlay (J) of image shown in H. EGFP expression is observed in the neural tube and lateral line (arrow). (K) Fluorescent image of the dorsal head at 48 hpf. EGFP expression is observed in the pancreas (arrow), inner ear (arrowhead, with bracket to indicate location of ear), and regions of the CNS. (L) Corresponding overlay of brightfield and fluorescent images. Abbreviations: L (Lens), Re (Retina), AYE (Anal Yolk Extension), Nc (Notochord), Nt (Neural tube). Scale bar: 250 (A); 250 microns (B, H); 100 microns (C, D, I, J); 50 microns (E); 50 microns (K, L).