
|
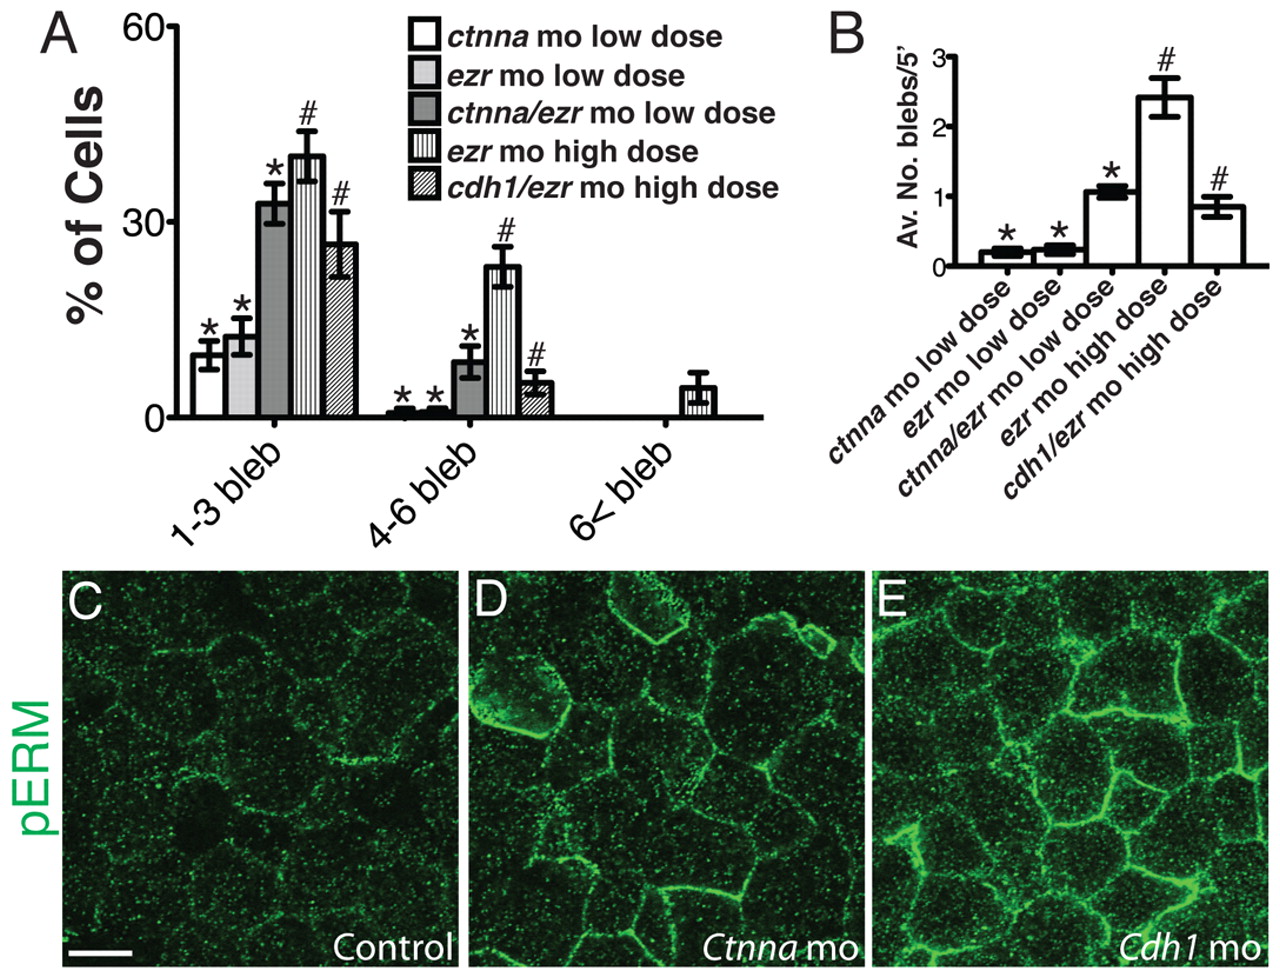
Fig. 9
αE-catenin and E-cadherin depletion influence ERM protein localization and membrane blebbing in ezr morphants. (A) Percentage of cells with bleb-like membrane protrusions. n=12 embryos. *P<10–6 ezr or ctnna mo low dose versus ctnna/ezr mo low dose, #P<10–6 ezr mo high dose versus cdh1/ezr mo high dose. (B) Average number of blebs per cell. n=12 embryos. *P<10–6 ezr or ctnna mo low dose versus ctnna/ezr mo low dose, #P<10–5 ezr mo high dose versus cdh1/ezr mo high dose. Error bars indicate s.e.m. (C-E) Confocal images of the most external epiblast layer at the animal pole of embryos at 50% epiboly stained for phospho-ERM proteins. (C) Uninjected control. (D) ctnna morphant. (E) cdh1 morphant. Scale bar: <10 μm.