
Fig. S5
- ID
- ZDB-IMAGE-120126-11
- Publication
- Peukert et al., 2011 - Lhx2 and lhx9 determine neuronal differentiation and compartition in the caudal forebrain by regulating wnt signaling
- All Figures
- Figures for Peukert et al., 2011
|
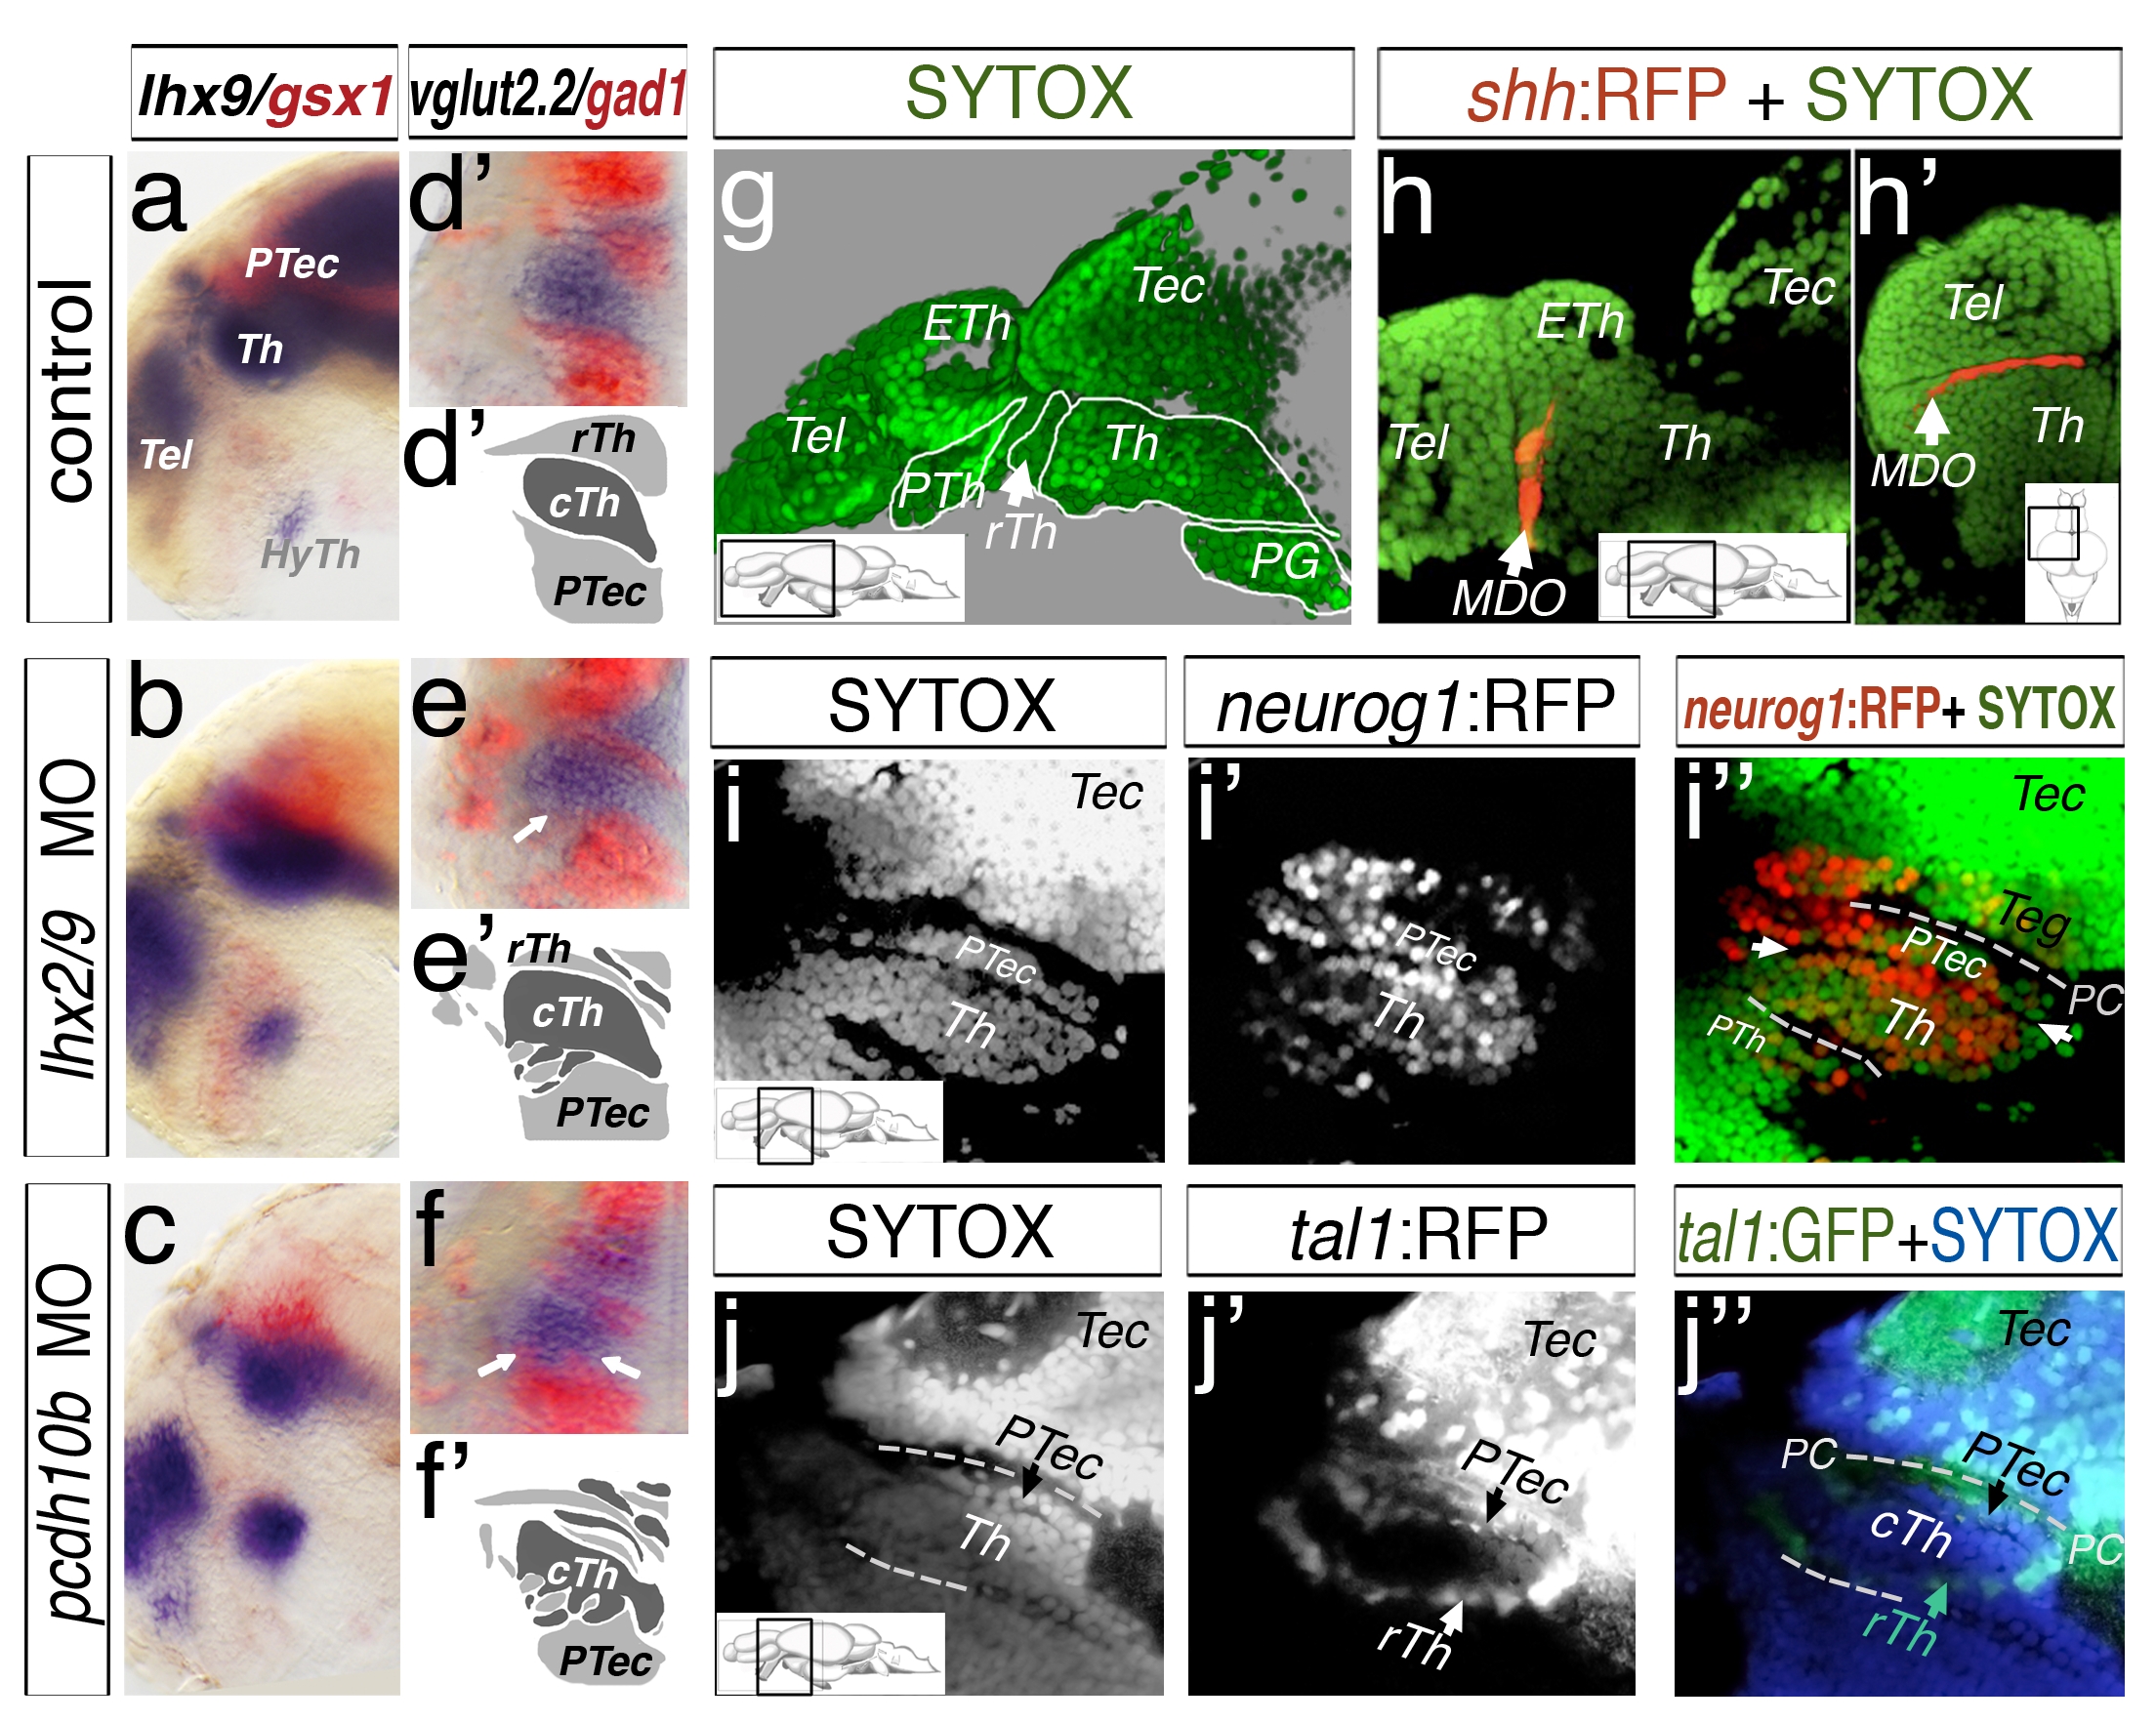
Fig. S5
Mapping of the diencephalon in larval stage via SYTOX nuclei staining. Analyses at 48 hpf, lateral view (a, b, c) and dorsal sections of left hemispheres (d–f2) are shown. Lhx9 marks the thalamus (a) and gsx1 the pretectum (a). In lhx2/lhx9 and pcdh10b morphant embryos, the expression domains overlap. A similar intermingling of expression domains is visible in embryos stained for vglut2.2 and gad1 (d–f2). Embryos have been analyzed at 4 dpf by a confocal microscopy analysis of ubiquitous nuclei staining by Sytox (g–j3). The analyzed section of the lateral view except dorsal view (h2) is indicated by a schematic drawing (insert). A sytox staining in green reveals structures of the forebrain and midbrain (g). To confirm the position of the thalamus, we analyzed the shh:RFP transgenic line, marking the MDO anterior to the thalamus (Th, b, b2). The position of the thalamus and pretectum (PTec) was mapped in the neurog1:RFP transgenic line (i–i3). To distinguish between the caudal thalamus (cTh) and pretectum, we also analyzed the tal1:GFP transgenic line. It labels GABAergic neurons of the rostral thalamus (rTh) and pretectum and therefore identifies the cell nuclei loose border zone between thalamus and pretectum (j–j3). ETh, epithalamus; HyTh, hypothalamus; MDO, mid-diencephalic-organizer; PC, posterior commissure; PG, preglomerular complex; PTec, pretectum; PTh, prethalamus; pTu, posterior tuberculum; RP, roof plate; rTh, rostral thalamus; Tec, tectum; Tel, telencephalon; Th, thalamus.